Lesson 5
NYS COMMON CORE MATHEMATICS CURRICULUM
M4
ALGEBRA II
Lesson 5: Events and Venn Diagrams
Student Outcomes
Students represent events by shading appropriate regions in a Venn diagram.
Given a chance experiment with equally likely outcomes, students calculate counts and probabilities by adding
or subtracting given counts or probabilities.
Students interpret probabilities in context.
Lesson Notes
This lesson introduces Venn diagrams to represent the sample space and various events and sets the stage for the two
lessons that follow, which introduce students to probability formulas. The purpose is to provide a bridge between using
the two-way table approach and using formulas to calculate probabilities. Venn diagrams also provide an opportunity to
visually represent the population needed to understand what is requested in the exercises.
Classwork
Opening (4 minutes)
While blank Venn diagrams are supplied for most exercises, use the examples to informally assess students. As students
become proficient with Venn diagrams, consider asking them to solve without providing the diagrams.
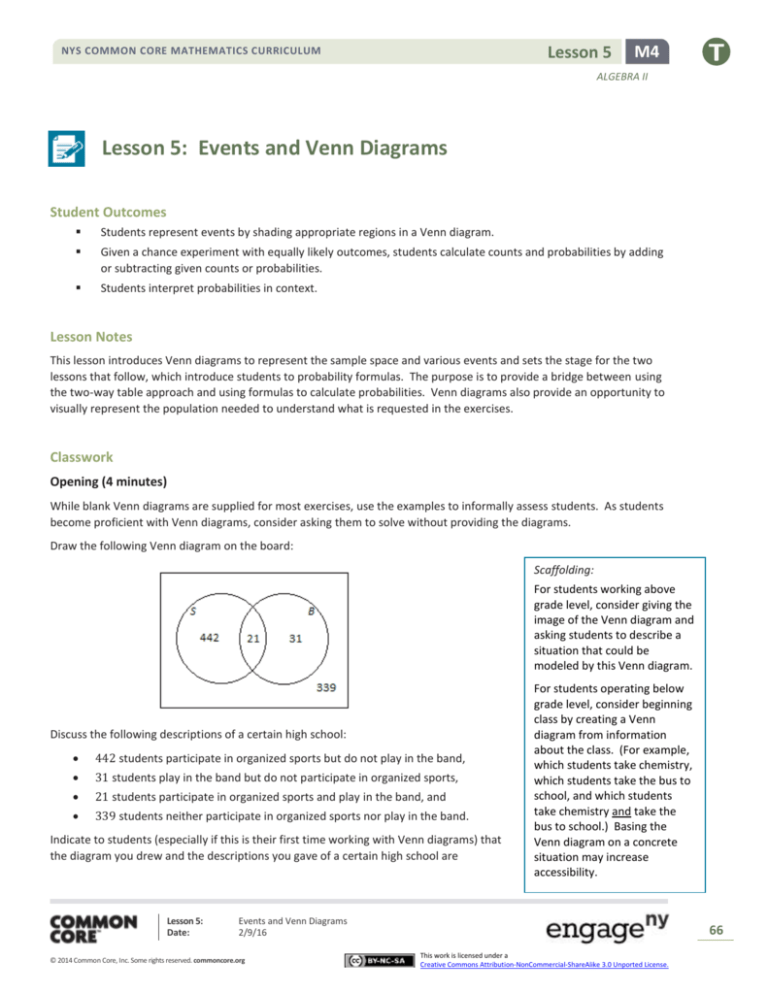
Draw the following Venn diagram on the board:
Scaffolding:
For students working above
grade level, consider giving the
image of the Venn diagram and
asking students to describe a
situation that could be
modeled by this Venn diagram.
Discuss the following descriptions of a certain high school:
442 students participate in organized sports but do not play in the band,
31 students play in the band but do not participate in organized sports,
21 students participate in organized sports and play in the band, and
339 students neither participate in organized sports nor play in the band.
Indicate to students (especially if this is their first time working with Venn diagrams) that
the diagram you drew and the descriptions you gave of a certain high school are
Lesson 5:
Date:
For students operating below
grade level, consider beginning
class by creating a Venn
diagram from information
about the class. (For example,
which students take chemistry,
which students take the bus to
school, and which students
take chemistry and take the
bus to school.) Basing the
Venn diagram on a concrete
situation may increase
accessibility.
Events and Venn Diagrams
2/9/16
© 2014 Common Core, Inc. Some rights reserved. commoncore.org
66
This work is licensed under a
Creative Commons Attribution-NonCommercial-ShareAlike 3.0 Unported License.
NYS COMMON CORE MATHEMATICS CURRICULUM
Lesson 5
M4
ALGEBRA II
connected. Ask students what they think the outer rectangle represents. If necessary to continue this discussion, point
out that the rectangle is a visual representation of all of the student population of the school (emphasize population).
Also ask students to explain what they think the circle labeled 𝑆 represents and what the circle labeled 𝐵 represents.
Allow your students to develop a description of circle 𝑆 as high school students who participate in sports and circle 𝐵 as
students who play in the band. Ask them to also explain why the circles overlap and what the overlapping part of the
MP.1 circles represents in this school. As students begin to make sense of this diagram with the numbers provided about this
&
MP.2 high school, ask them the following questions:
How many students participate in organized sports?
442 + 21 = 463
How many students play in the band?
How many students do not participate in organized sports?
31 + 21 = 52
31 + 339 = 370
How many students participate in organized sports or play in the band? (Explain that or always includes the
possibility of both.)
442 + 21 + 31 = 494
Connecting the numbers in the Venn diagram to probability questions will be a focus of this lesson.
Example 1 (5 minutes): Shading Regions of a Venn Diagram
Here students are introduced to Venn diagrams and are shown the process of shading appropriate regions. Work
through each part as a class.
Example 1: Shading Regions of a Venn Diagram
At a high school, some students play soccer and some do not. Also, some students play basketball and some do not. This
scenario can be represented by a Venn diagram, as shown below. The circle labeled 𝑺 represents the students who play
soccer, the circle labeled 𝑩 represents the students who play basketball, and the rectangle represents all the students at
the school.
Lesson 5:
Date:
Events and Venn Diagrams
2/9/16
© 2014 Common Core, Inc. Some rights reserved. commoncore.org
67
This work is licensed under a
Creative Commons Attribution-NonCommercial-ShareAlike 3.0 Unported License.
Lesson 5
NYS COMMON CORE MATHEMATICS CURRICULUM
M4
ALGEBRA II
On the Venn diagrams provided, shade the region representing the students who
a.
play soccer.
b.
do not play soccer.
c.
play soccer and basketball.
d.
play soccer or basketball.
Exercise 1 (5 minutes)
Let students work individually shading regions of a Venn diagram. Then allow them to compare answers with a
neighbor.
Exercise 1
An online bookstore offers a large selection of books. Some of the books are works of fiction, and some are not. Also,
some of the books are available as e-books, and some are not. Let 𝑭 be the set of books that are works of fiction, and let
𝑬 be the set of books that are available as e-books. On the Venn diagrams provided, shade the regions representing
books that are
a.
available as e-books.
Lesson 5:
Date:
b.
not works of fiction.
Events and Venn Diagrams
2/9/16
© 2014 Common Core, Inc. Some rights reserved. commoncore.org
68
This work is licensed under a
Creative Commons Attribution-NonCommercial-ShareAlike 3.0 Unported License.
Lesson 5
NYS COMMON CORE MATHEMATICS CURRICULUM
M4
ALGEBRA II
c.
works of fiction and available as e-books.
d.
works of fiction or available as e-books.
e.
neither works of fiction nor available as e-books.
f.
works of fiction that are not available as e-books.
Example 2 (6 minutes): Showing Numbers of Possible Outcomes (and Probabilities) in a Venn Diagram
Students are introduced to the use of Venn diagrams to display numbers of possible outcomes and probabilities and how
these numbers or probabilities can be added or subtracted.
Note that the technique of showing the number (or probability) associated with an entire circle in the Venn diagram uses
a line drawn to the circle. This is the only way to add this information to the diagram without introducing confusion.
Each of the probabilities in the final part of the question is calculated by dividing the equivalent number in the first Venn
diagram by 500. It is important to point out to the students that the four probabilities in the diagram sum to 1, as this
fact will be used in the exercises that follow.
Example 2: Showing Numbers of Possible Outcomes (and Probabilities) in a Venn Diagram
Think again about the school introduced in Example 1. Suppose that 𝟐𝟑𝟎 students play soccer, 𝟏𝟗𝟎 students play
basketball, and 𝟔𝟎 students play both sports. There are a total of 𝟓𝟎𝟎 students at the school.
a.
Complete the Venn diagram below by writing the numbers of students in the various regions of the diagram.
Answer:
Lesson 5:
Date:
Events and Venn Diagrams
2/9/16
© 2014 Common Core, Inc. Some rights reserved. commoncore.org
69
This work is licensed under a
Creative Commons Attribution-NonCommercial-ShareAlike 3.0 Unported License.
Lesson 5
NYS COMMON CORE MATHEMATICS CURRICULUM
M4
ALGEBRA II
b.
How many students play basketball but not soccer?
𝟏𝟗𝟎 − 𝟔𝟎 = 𝟏𝟑𝟎
c.
Suppose that a student will be selected at random from the school.
i.
What is the probability that the selected student plays both sports?
𝟔𝟎
= 𝟎. 𝟏𝟐
𝟓𝟎𝟎
ii.
Complete the Venn diagram below by writing the probabilities associated with the various regions of
the diagram.
Answer:
Example 3 (8 minutes): Adding and Subtracting Probabilities
Students are introduced to problems where probabilities (not counts) are given and to more challenging additions and
subtractions than in Example 2. The proportions are given as percentages in the questions, but the solution should be
expressed entirely in terms of decimals.
Part (b) is designed to demonstrate that students are doing the same work as in the previous lessons but expressing it in
a different way (Venn diagrams instead of hypothetical 1000 tables). However, the process of transcribing the
probabilities from the Venn diagram to the table is a relatively straightforward one; so, you can omit this part of the
question if you feel you might be short of time. Nonetheless, it is important that students be aware that both
approaches are valid and ultimately lead to the same answer.
Example 3: Adding and Subtracting Probabilities
Think again about the online bookstore introduced in Exercise 1, and suppose that 𝟔𝟐% of the books are works of fiction,
𝟒𝟕% are available as e-books, and 𝟏𝟒% are available as e-books but are not works of fiction. A book will be selected at
random.
a.
Using a Venn diagram, find the probability that the book
will be
i.
a work of fiction and available as an e-book.
𝑷(𝑭 and 𝑬) = 𝟎. 𝟑𝟑
ii.
neither a work of fiction nor available as an e-book.
𝑷(𝒏𝒆𝒊𝒕𝒉𝒆𝒓 𝑭 𝒏𝒐𝒓 𝑬) = 𝟎. 𝟐𝟒
Lesson 5:
Date:
Events and Venn Diagrams
2/9/16
© 2014 Common Core, Inc. Some rights reserved. commoncore.org
70
This work is licensed under a
Creative Commons Attribution-NonCommercial-ShareAlike 3.0 Unported License.
Lesson 5
NYS COMMON CORE MATHEMATICS CURRICULUM
M4
ALGEBRA II
b.
Return to the information given at the beginning of the question: 𝟔𝟐% of the books
are works of fiction, 𝟒𝟕% are available as e-books, and 𝟏𝟒% are available as e-books
but are not works of fiction.
i.
How would this information be shown in a hypothetical 1000 table? (Show
your answers in the table provided below.)
Available as E-Book
Not Available as E-Book
Total
Fiction
𝟑𝟑𝟎
𝟐𝟗𝟎
𝟔𝟐𝟎
Not Fiction
𝟏𝟒𝟎
𝟐𝟒𝟎
𝟑𝟖𝟎
Scaffolding:
Consider asking students to
generate their own table rather
than completing one that is
already constructed.
Total
𝟒𝟕𝟎
𝟓𝟑𝟎
𝟏, 𝟎𝟎𝟎
ii.
Complete the hypothetical 1000 table given above.
iii.
Complete the table below showing the probabilities of the events represented by the cells in the table.
Available as E-Book
Not available as E-Book
Total
iv.
Fiction
𝟎. 𝟑𝟑
𝟎. 𝟐𝟗
𝟎. 𝟔𝟐
Not Fiction
𝟎. 𝟏𝟒
𝟎. 𝟐𝟒
𝟎. 𝟑𝟖
Total
𝟎. 𝟒𝟕
𝟎. 𝟓𝟑
𝟏
How do the probabilities in your table relate to the probabilities you calculated in part (a)?
The probabilities are the same.
Exercise 2 (5 minutes)
Students practice the approaches introduced in the preceding examples. In this exercise, students are given an
MP.2 opportunity to reason abstractly and quantitatively by using a Venn diagram to represent the given information and
answering questions about probability.
Let students work with a partner and confirm answers as a class. In this exercise, you could permit students to omit part
(c) if you feel they might be short of time.
Exercise 2
When a fish is selected at random from a tank, the probability that it has a green tail is 𝟎. 𝟔𝟒, the probability that it has
red fins is 𝟎. 𝟐𝟓, and the probability that it has both a green tail and red fins is 𝟎. 𝟏𝟗.
a.
Draw a Venn diagram to represent this information.
Lesson 5:
Date:
Events and Venn Diagrams
2/9/16
© 2014 Common Core, Inc. Some rights reserved. commoncore.org
71
This work is licensed under a
Creative Commons Attribution-NonCommercial-ShareAlike 3.0 Unported License.
Lesson 5
NYS COMMON CORE MATHEMATICS CURRICULUM
M4
ALGEBRA II
b.
Find the probability that the fish has
i.
red fins but does not have a green tail.
𝟎. 𝟐𝟓 − 𝟎. 𝟏𝟗 = 𝟎. 𝟎𝟔
ii.
a green tail but not red fins.
𝟎. 𝟔𝟒 − 𝟎. 𝟏𝟗 = 𝟎. 𝟒𝟓
iii.
neither a green tail nor red fins.
𝟏 − 𝟎. 𝟒𝟓 − 𝟎. 𝟏𝟗 − 𝟎. 𝟎𝟔 = 𝟎. 𝟑𝟎
c.
Complete the table below showing the probabilities of the events corresponding to the cells of the table.
Red Fins
Not Red Fins
Total
Green tail
𝟎. 𝟏𝟗
𝟎. 𝟒𝟓
𝟎. 𝟔𝟒
Not green tail
𝟎. 𝟎𝟔
𝟎. 𝟑𝟎
𝟎. 𝟑𝟔
Total
𝟎. 𝟐𝟓
𝟎. 𝟕𝟓
𝟏. 𝟎𝟎
Exercise 3 (5 minutes)
This exercise is slightly more challenging and provides additional practice with the process of adding and subtracting
probabilities using a Venn diagram. The proportions are given in the question as percentages, but the solution should be
expressed entirely in terms of decimals, as probabilities are typically expressed on a scale from 0 to 1.
Let students continue to work with a partner and then confirm the answer as a class.
Exercise 3
In a company, 𝟒𝟑% of the employees have access to a fax machine, 𝟑𝟖% have access to a fax machine and a scanner, and
𝟐𝟒% have access to neither a fax machine nor a scanner. Suppose that an employee will be selected at random. Using a
Venn diagram, calculate the probability that the randomly selected employee will not have access to a scanner. (Note
that Venn diagrams and probabilities use decimals or fractions, not percentages.) Explain how you used the Venn
diagram to determine your answer.
𝑷(𝒏𝒐𝒕 𝑺) = 𝟎. 𝟎𝟓 + 𝟎. 𝟐𝟒 = 𝟎. 𝟐𝟗
I can see from the Venn diagram that 𝟓% of the employees have access to
a fax machine but not a scanner, and 𝟐𝟒% don’t have access to either. So,
I combined the two to find the probability that a randomly selected
employee will not have access to a scanner.
Lesson 5:
Date:
Events and Venn Diagrams
2/9/16
© 2014 Common Core, Inc. Some rights reserved. commoncore.org
72
This work is licensed under a
Creative Commons Attribution-NonCommercial-ShareAlike 3.0 Unported License.
Lesson 5
NYS COMMON CORE MATHEMATICS CURRICULUM
M4
ALGEBRA II
Closing (2 minutes)
If time allows, consider introducing the mathematical symbols for “and,” “or,” and “not.” This terminology and the
notation for intersections, unions, and complements are introduced in Problem 4 of the Problem Set, but if you have
time, consider doing this problem in class.
The intersection of the set 𝐴 and the set 𝐵 is written as 𝐴 ∩ 𝐵 and is read as 𝐴 intersect 𝐵. It consists of the
elements that are in both 𝐴 and 𝐵.
The union of the set 𝐴 and the set 𝐵 is written as 𝐴 ∪ 𝐵 and is read as 𝐴 union 𝐵. It consists of the elements
that are in either 𝐴 or 𝐵 or both.
The complement of the set 𝐴 is written as 𝐴𝐶 and is read as 𝐴 complement. It consists of the elements that are
not in 𝐴. Other common notations for the 𝐴 complement are 𝐴′ and 𝐴̅.
Note that it may be useful for students to have access to these symbols in a graphic organizer or as a visual on a poster.
This should include the symbol, what it is called, and what it means.
Ask students to summarize the main ideas of the lesson in writing or with a neighbor. Use this as an opportunity to
informally assess comprehension of the lesson. The Lesson Summary below offers some important concepts that should
be included.
Lesson Summary
In a probability experiment, the events can be represented by circles in a Venn diagram.
Combinations of events using “and,” “or,” and “not” can be shown by shading the appropriate regions of the Venn
diagram.
The number of possible outcomes can be shown in each region of the Venn diagram; alternatively, probabilities
may be shown. The number of outcomes in a given region (or the probability associated with it) can be calculated
by adding or subtracting the known numbers of possible outcomes (or probabilities).
Exit Ticket (5 minutes)
Lesson 5:
Date:
Events and Venn Diagrams
2/9/16
© 2014 Common Core, Inc. Some rights reserved. commoncore.org
73
This work is licensed under a
Creative Commons Attribution-NonCommercial-ShareAlike 3.0 Unported License.
Lesson 5
NYS COMMON CORE MATHEMATICS CURRICULUM
M4
ALGEBRA II
Name
Date
Lesson 5: Events and Venn Diagrams
Exit Ticket
1.
At a high school, some students take Spanish and some do not. Also, some students take an arts subject, and some
do not. Let 𝑆 be the set of students who take Spanish and 𝐴 be the set of students who take an arts subject. On the
Venn diagrams given, shade the region representing the students who
a.
take Spanish and an arts subject.
b.
take Spanish or an arts subject.
c.
take Spanish but do not take an arts subject.
d.
do not take an arts subject.
Lesson 5:
Date:
Events and Venn Diagrams
2/9/16
© 2014 Common Core, Inc. Some rights reserved. commoncore.org
74
This work is licensed under a
Creative Commons Attribution-NonCommercial-ShareAlike 3.0 Unported License.
NYS COMMON CORE MATHEMATICS CURRICULUM
Lesson 5
M4
ALGEBRA II
2.
When a player is selected at random from a high school boys’ baseball team, the probability that he is a pitcher is
0.35, the probability that he is right-handed is 0.79, and the probability that he is a right-handed pitcher is 0.26. Let
𝑃 be the event that a player is a pitcher, and let 𝑅 be the event that a player is right-handed. A Venn diagram is
provided below.
Use the Venn diagram to calculate the probability that a randomly selected player is each of the following. Explain
how you used the Venn diagram to determine your answer.
a.
right-handed but not a pitcher
b.
a pitcher but not right-handed
c.
neither right-handed nor a pitcher
Lesson 5:
Date:
Events and Venn Diagrams
2/9/16
© 2014 Common Core, Inc. Some rights reserved. commoncore.org
75
This work is licensed under a
Creative Commons Attribution-NonCommercial-ShareAlike 3.0 Unported License.
Lesson 5
NYS COMMON CORE MATHEMATICS CURRICULUM
M4
ALGEBRA II
Exit Ticket Sample Solutions
1.
2.
At a high school, some students take Spanish and some do not. Also, some students take an arts subject, and some
do not. Let 𝑺 be the set of students who take Spanish and 𝑨 be the set of students who take an arts subject. On the
Venn diagrams given, shade the region representing the students who
a.
take Spanish and an arts subject.
b.
take Spanish or an arts subject.
c.
take Spanish but do not take an arts subject.
d.
do not take an arts subject.
When a player is selected at random from a high school boys’ baseball team, the probability that he is a pitcher is
𝟎. 𝟑𝟓, the probability that he is right-handed is 𝟎. 𝟕𝟗, and the probability that he is a right-handed pitcher is 𝟎. 𝟐𝟔.
Let 𝑷 be the event that a player is a pitcher, and let 𝑹 be the event that a player is right-handed. A Venn diagram is
provided below.
Use the Venn diagram to calculate the probability that a randomly selected player is each of the following. Explain how
you used the Venn diagram to determine your answer.
a.
right-handed but not a pitcher
𝟎. 𝟕𝟗 − 𝟎. 𝟐𝟔 = 𝟎. 𝟓𝟑
I found the probability that the player was right-handed (𝟎. 𝟕𝟗) and subtracted the probability that the player
was also a pitcher (𝟎. 𝟐𝟔).
Lesson 5:
Date:
Events and Venn Diagrams
2/9/16
© 2014 Common Core, Inc. Some rights reserved. commoncore.org
76
This work is licensed under a
Creative Commons Attribution-NonCommercial-ShareAlike 3.0 Unported License.
Lesson 5
NYS COMMON CORE MATHEMATICS CURRICULUM
M4
ALGEBRA II
b.
a pitcher but not right-handed
𝟎. 𝟑𝟓 − 𝟎. 𝟐𝟔 = 𝟎. 𝟎𝟗
I found the probability that the player was a pitcher (𝟎. 𝟑𝟓) and subtracted the probability that the player was
also right-handed (𝟎. 𝟐𝟔).
c.
neither right-handed nor a pitcher
𝟏 − 𝟎. 𝟎𝟗 − 𝟎. 𝟐𝟔 − 𝟎. 𝟓𝟑 = 𝟎. 𝟏𝟐
I used the Venn diagram to determine all of the probabilities associated with the player being right-handed
and/or a pitcher. Then I subtracted each from 𝟏 to find the probability that the player was not either.
Problem Set Sample Solutions
1.
On a flight, some of the passengers have frequent flier status and some do not. Also, some of the passengers have
checked baggage and some do not. Let the set of passengers who have frequent flier status be 𝑭 and the set of
passengers who have checked baggage be 𝑪. On the Venn diagrams provided, shade the regions representing
passengers who
a.
have frequent flier status and have checked
baggage.
b.
have frequent flier status or have checked
baggage.
c.
do not have both frequent flier status and
checked baggage.
d.
have frequent flier status or do not have
checked baggage.
Lesson 5:
Date:
Events and Venn Diagrams
2/9/16
© 2014 Common Core, Inc. Some rights reserved. commoncore.org
77
This work is licensed under a
Creative Commons Attribution-NonCommercial-ShareAlike 3.0 Unported License.
Lesson 5
NYS COMMON CORE MATHEMATICS CURRICULUM
M4
ALGEBRA II
2.
For the scenario introduced in Problem 1, suppose that, of the 𝟒𝟎𝟎 people on the flight, 𝟑𝟔𝟖 have checked baggage,
𝟐𝟐𝟖 have checked baggage but do not have frequent flier status, and 𝟖 have neither frequent flier status nor
checked baggage.
a.
Using a Venn diagram, calculate the number of people on the flight who
i.
have frequent flier status and have checked
baggage.
The number of passengers with frequent flier
status and checked baggage is 𝟑𝟔𝟖 − 𝟐𝟐𝟖 =
𝟏𝟒𝟎.
ii.
have frequent flier status.
The number of passengers with frequent flier
status is 𝟒𝟎𝟎 − 𝟖 − 𝟐𝟐𝟖 = 𝟏𝟔𝟒.
b.
In the Venn diagram provided below, write the probabilities of the events associated with the regions marked
with a star (*).
Answer:
3.
When an animal is selected at random from those at a zoo, the probability that it is North American (meaning that
its natural habitat is in the North American continent) is 𝟎. 𝟔𝟓, the probability that it is both North American and a
carnivore is 𝟎. 𝟏𝟔, and the probability that it is neither American nor a carnivore is 𝟎. 𝟏𝟕.
a.
Using a Venn diagram, calculate the probability that a randomly selected animal is a carnivore.
𝑷(𝑪) = 𝟎. 𝟏𝟔 + 𝟎. 𝟏𝟖 = 𝟎. 𝟑𝟒
b.
Complete the table below showing the probabilities of the events corresponding to the cells of the table.
Carnivore
Not carnivore
Total
Lesson 5:
Date:
American
𝟎. 𝟏𝟔
𝟎. 𝟒𝟗
𝟎. 𝟔𝟓
Not American
𝟎. 𝟏𝟖
𝟎. 𝟏𝟕
𝟎. 𝟑𝟓
Total
𝟎. 𝟑𝟒
𝟎. 𝟔𝟔
𝟏. 𝟎𝟎
Events and Venn Diagrams
2/9/16
© 2014 Common Core, Inc. Some rights reserved. commoncore.org
78
This work is licensed under a
Creative Commons Attribution-NonCommercial-ShareAlike 3.0 Unported License.
Lesson 5
NYS COMMON CORE MATHEMATICS CURRICULUM
M4
ALGEBRA II
4.
This question introduces the mathematical symbols for “and,” “or,” and “not.”
Considering all the people in the world, let 𝑨 be the set of Americans (citizens of the United States), and let 𝑩 be the
set of people who have brothers.
The set of people who are Americans and have brothers is represented by the shaded region in the Venn
diagram below.
This set is written 𝑨 ∩ 𝑩 (read “𝑨 intersect 𝑩”), and the probability that a randomly selected person is
American and has a brother is written 𝑷(𝑨 ∩ 𝑩).
The set of people who are Americans or have brothers is represented by the shaded region in the Venn
diagram below.
This set is written 𝑨 ∪ 𝑩 (read “𝑨 union 𝑩”), and the probability that a randomly selected person is American
or has a brother is written 𝑷(𝑨 ∪ 𝑩).
The set of people who are not Americans is represented by the shaded region in the Venn diagram below.
This set is written 𝑨𝑪 (read “𝑨 complement”), and the probability that a randomly selected person is not
American is written 𝑷(𝑨𝑪 ).
Lesson 5:
Date:
Events and Venn Diagrams
2/9/16
© 2014 Common Core, Inc. Some rights reserved. commoncore.org
79
This work is licensed under a
Creative Commons Attribution-NonCommercial-ShareAlike 3.0 Unported License.
Lesson 5
NYS COMMON CORE MATHEMATICS CURRICULUM
M4
ALGEBRA II
Now think about the cars available at a dealership. Suppose a car is selected at random from the cars at this dealership.
Let the event that the car has manual transmission be denoted by 𝑴, and let the event that the car is a sedan be denoted
by 𝑺. The Venn diagram below shows the probabilities associated with four of the regions of the diagram.
a.
What is the value of 𝑷(𝑴 ∩ 𝑺)?
𝟎. 𝟏𝟐
b.
Complete this sentence using and/or:
𝑷(𝑴 ∩ 𝑺) is the probability that a randomly selected car has a manual transmission and is a sedan.
c.
What is the value of 𝑷(𝑴 ∪ 𝑺)?
𝟎. 𝟎𝟗 + 𝟎. 𝟏𝟐 + 𝟎. 𝟔𝟎 = 𝟎. 𝟖𝟏
d.
Complete this sentence using and/or:
𝑷(𝑴 ∪ 𝑺) is the probability that a randomly selected car has a manual transmission or is a sedan.
e.
What is the value of 𝑷(𝑺𝑪 )?
𝟏 − (𝟎. 𝟔 + 𝟎. 𝟏𝟐) = 𝟎. 𝟐𝟖
f.
Explain the meaning of 𝑷(𝑺𝑪 ).
𝑷(𝑺𝑪 ) is the probability that a randomly selected car is not a sedan.
Lesson 5:
Date:
Events and Venn Diagrams
2/9/16
© 2014 Common Core, Inc. Some rights reserved. commoncore.org
80
This work is licensed under a
Creative Commons Attribution-NonCommercial-ShareAlike 3.0 Unported License.

