2013GB004689ts01
advertisement
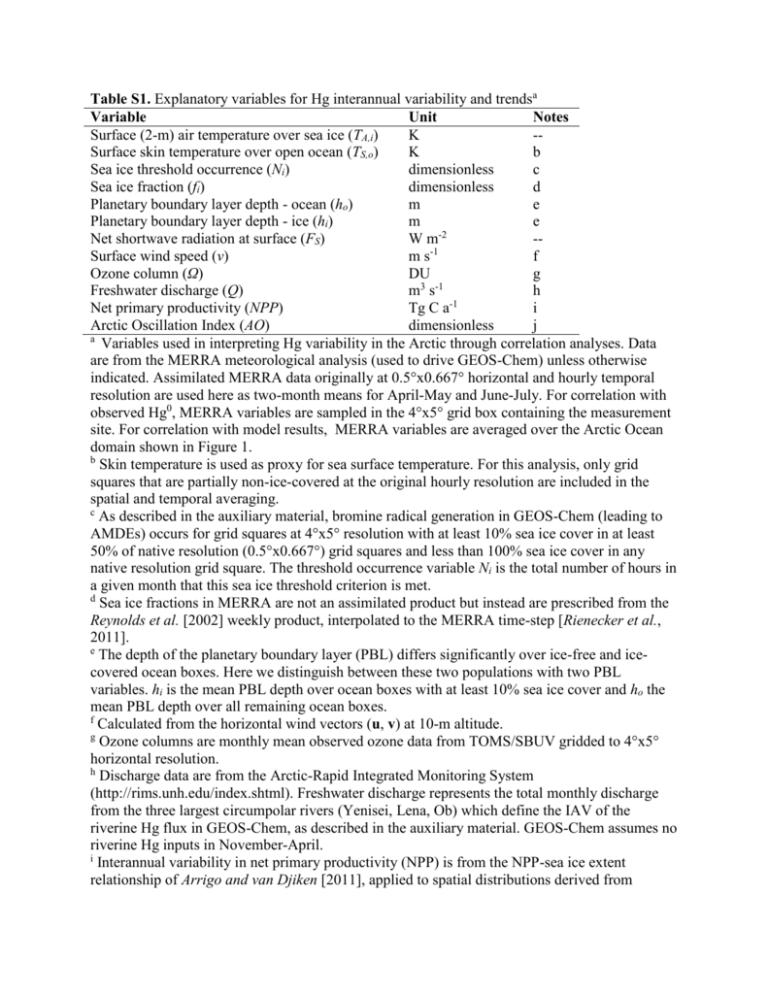
Table S1. Explanatory variables for Hg interannual variability and trendsa Variable Unit Notes Surface (2-m) air temperature over sea ice (TA,i) K -Surface skin temperature over open ocean (TS,o) K b Sea ice threshold occurrence (Ni) dimensionless c Sea ice fraction (fi) dimensionless d Planetary boundary layer depth - ocean (ho) m e Planetary boundary layer depth - ice (hi) m e Net shortwave radiation at surface (FS) W m-2 -Surface wind speed (v) m s-1 f Ozone column (Ω) DU g Freshwater discharge (Q) m3 s-1 h -1 Net primary productivity (NPP) Tg C a i Arctic Oscillation Index (AO) dimensionless j a Variables used in interpreting Hg variability in the Arctic through correlation analyses. Data are from the MERRA meteorological analysis (used to drive GEOS-Chem) unless otherwise indicated. Assimilated MERRA data originally at 0.5°x0.667° horizontal and hourly temporal resolution are used here as two-month means for April-May and June-July. For correlation with observed Hg0, MERRA variables are sampled in the 4°x5° grid box containing the measurement site. For correlation with model results, MERRA variables are averaged over the Arctic Ocean domain shown in Figure 1. b Skin temperature is used as proxy for sea surface temperature. For this analysis, only grid squares that are partially non-ice-covered at the original hourly resolution are included in the spatial and temporal averaging. c As described in the auxiliary material, bromine radical generation in GEOS-Chem (leading to AMDEs) occurs for grid squares at 4°x5° resolution with at least 10% sea ice cover in at least 50% of native resolution (0.5°x0.667°) grid squares and less than 100% sea ice cover in any native resolution grid square. The threshold occurrence variable Ni is the total number of hours in a given month that this sea ice threshold criterion is met. d Sea ice fractions in MERRA are not an assimilated product but instead are prescribed from the Reynolds et al. [2002] weekly product, interpolated to the MERRA time-step [Rienecker et al., 2011]. e The depth of the planetary boundary layer (PBL) differs significantly over ice-free and icecovered ocean boxes. Here we distinguish between these two populations with two PBL variables. hi is the mean PBL depth over ocean boxes with at least 10% sea ice cover and ho the mean PBL depth over all remaining ocean boxes. f Calculated from the horizontal wind vectors (u, v) at 10-m altitude. g Ozone columns are monthly mean observed ozone data from TOMS/SBUV gridded to 4°x5° horizontal resolution. h Discharge data are from the Arctic-Rapid Integrated Monitoring System (http://rims.unh.edu/index.shtml). Freshwater discharge represents the total monthly discharge from the three largest circumpolar rivers (Yenisei, Lena, Ob) which define the IAV of the riverine Hg flux in GEOS-Chem, as described in the auxiliary material. GEOS-Chem assumes no riverine Hg inputs in November-April. i Interannual variability in net primary productivity (NPP) is from the NPP-sea ice extent relationship of Arrigo and van Djiken [2011], applied to spatial distributions derived from combining the POP-ICE sea ice-ecosystem model with MODIS satellite data, as described in the auxiliary material. j Monthly mean Arctic Oscillation Index from the National Oceanic and Atmospheric Administration (NOAA) / National Weather Service (NWS) National Centers for Environmental Prediction (NCEP) Climate Prediction Center (CPC), available at http://www.cpc.ncep.noaa.gov/products/precip/CWlink/daily_ao_index/ao.shtml.
