AP Statistics: Linear Transformations Practice
advertisement
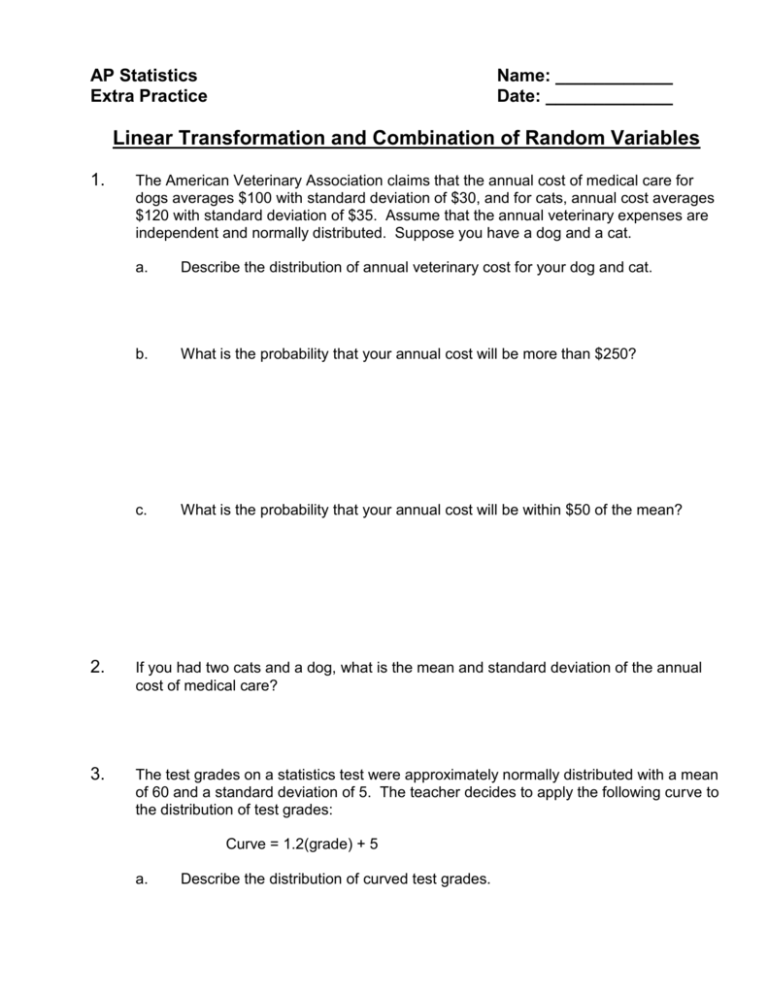
AP Statistics Extra Practice Name: ____________ Date: _____________ Linear Transformation and Combination of Random Variables 1. The American Veterinary Association claims that the annual cost of medical care for dogs averages $100 with standard deviation of $30, and for cats, annual cost averages $120 with standard deviation of $35. Assume that the annual veterinary expenses are independent and normally distributed. Suppose you have a dog and a cat. a. Describe the distribution of annual veterinary cost for your dog and cat. b. What is the probability that your annual cost will be more than $250? c. What is the probability that your annual cost will be within $50 of the mean? 2. If you had two cats and a dog, what is the mean and standard deviation of the annual cost of medical care? 3. The test grades on a statistics test were approximately normally distributed with a mean of 60 and a standard deviation of 5. The teacher decides to apply the following curve to the distribution of test grades: Curve = 1.2(grade) + 5 a. Describe the distribution of curved test grades. 4. 5. b. What is the probability that a randomly selected student would have a passing grade ( 70) with the curve? c. What is the probability that randomly selected student would have a curved grade within 5 points of the curved mean? A student was performing an experiment that compared a new protein food to the old food for goldfish. He found the mean weight gain for the new food to be 12.8 grams with a standard deviation of 3.5 grams. Later he realized that the scale was out of calibration by 1.5 grams (meaning that the scale weighed items 1.5 grams too much). Adjust the distribution for this error. a. Describe the distribution of adjusted weight gain for the new food. b. What is the probability that a randomly selected goldfish would have an adjusted weight gain of less than 9.5 grams? The heights of female teachers at HHS are normally distributed with mean of 65.5 inches and standard deviation of 2.25 inches. The heights of male teachers are normally distributed with mean of 70 inches and standard deviation of 2.5 inches. a. Describe the distribution of differences of heights (male – female) teachers. b. What is the probability that a randomly selected male teacher is shorter than a randomly selected female teacher?
