Picture Graphs - Carroll County Public Schools
advertisement
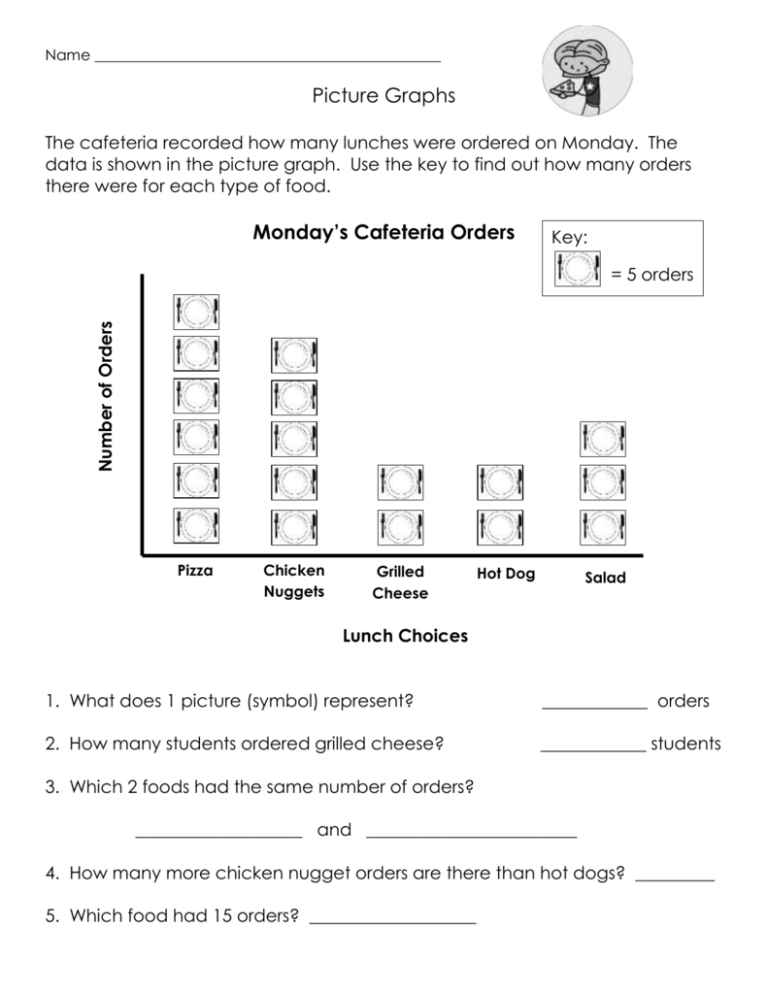
Name ______________________________________________ Picture Graphs The cafeteria recorded how many lunches were ordered on Monday. The data is shown in the picture graph. Use the key to find out how many orders there were for each type of food. Monday’s Cafeteria Orders Key: Number of Orders = 5 orders Pizza Chicken Nuggets Grilled Cheese Hot Dog Salad Lunch Choices 1. What does 1 picture (symbol) represent? ____________ orders 2. How many students ordered grilled cheese? ____________ students 3. Which 2 foods had the same number of orders? ___________________ and ________________________ 4. How many more chicken nugget orders are there than hot dogs? _________ 5. Which food had 15 orders? ___________________ Mrs. Chucko’s students were asked about their favorite flowers. Use the key to find out how many students liked each type of flower. Favorite Flowers Key: Number of Students = 2 students Violet Tulip Rose Lily Daisy Petunia Types of Flowers 1. How many students chose tulips? _______________ 2. Four students chose what type of flower? _________________ 3. Write an addition sentence that represents the total number for rose. _____________________________ Write a multiplication sentence that represents the total number for rose. _____________________________ 4. How many more students chose rose than tulip? _______________ 5. Ten students chose “petunia.” Add that data to the graph. Name ______________________________________________ Date ___________________________ Painting Murals Students at Mechanicsville Elementary are painting murals in the school hallways. The graph below shows the cans of paint that were used. Use the graph and key to answer the questions that follow. Paints for Murals Key: Number of Cans = 5 cans Purple Red Green Yellow Blue Colors of Paint 1. How many paint cans were used? ___________________________ 2. Ten cans of blue were mislabeled as red. Change the graph to show the new data. 3. Twenty cans of purple paint were just used to add more to the murals. Change the graph to show the new data. 4. Write a question about this graph. Answer it. _________________________________________________________________________ _________________________________________________________________________ _________________________________________________________________________ _________________________________________________________________________ 5. How many more green cans were used than yellow? _____________________________________________________________________________ Name _________________________________________________________ Use this “Mural Paints” Graph to answer the following questions. Mural Paints Key: Number of Cans = 2 cans Purple Red Green Yellow Blue Paint Colors Write 2 questions about the graph. Answer your questions. Question # 1- ____________________________________________________ ________________________________________________________________ ________________________________________________________________ Answer - _______________________________________________________ Question#2 - ___________________________________________________ ________________________________________________________________ ________________________________________________________________ Answer - _______________________________________________________ The students need to mix equal amounts of red and yellow paints to make orange paint. If they end up with 4 cans of orange paint, how many cans of red and yellow are left that were not mixed? _____________________________________________________________________________ Name _____________________________________________ Favorite Breakfast Cereals Use the following data to complete the picture graph below. Cereals Eaten by Friendship Valley Students Brand Number of Students Lucky Charms 35 Raisin Bran 10 Corn Flakes 25 Cheerios 50 Cereals Eaten by Friendship Valley Students Key: = _____ students Lucky Charms Raisin Bran Corn Flakes Types of Cereal Cheerios 1. What can you tell about the cereals by looking at your graph above? __________________________________________________________________________ __________________________________________________________________________ __________________________________________________________________________ 2. Explain why your graph is correct. Use what you know about scale and picture graphs in your explanation. ___________________________________________________________________ ___________________________________________________________________ ___________________________________________________________________ ___________________________________________________________________ 4. How many more students chose Cheerios than Lucky Charms? Show your work. __________________ 5. Forty-five students prefer Honey Chex. Add this information to the graph. 6. How many students (including the Honey Chex students) participated in the survey? Show your thinking. Name: _______________________________________________ Vacation Travel Many third graders travelled from Westminster to other cities during the winter break. Use the graph to answer the questions that follow. Travel Time to Vacation Cities (by car) Key: Number of Hours = 4 hours New Orleans Lexington Bar Harbor Pittsburgh Dallas Destination 1. Which question cannot be answered by using the pictograph? A. How long does it take to drive to Bar Harbor? B. How much longer is the trip to Dallas than the trip to Lexington? C. How many students travelled to Pittsburgh? D. Which city is the closest to Westminster? 2. How much longer does it take to drive to Dallas than to Bar Harbor? _____________________________ 3. If the trip to New Orleans was 2 hours shorter, how would the pictograph need to be changed? ____________________________________________________________________ ____________________________________________________________________ 4. The trip to Pittsburgh is how much shorter than the trip to New Orleans? ____________________________________________________________________ The picture graph below is not complete. Use the data in the table to complete the picture graph. Pets Owned by 3rd Graders Dogs Cats Hamsters Chickens 21 12 15 6 Pets Owned by 3rd Graders Key: = _____ students TYPE OF PET
