Unit 6.1
advertisement
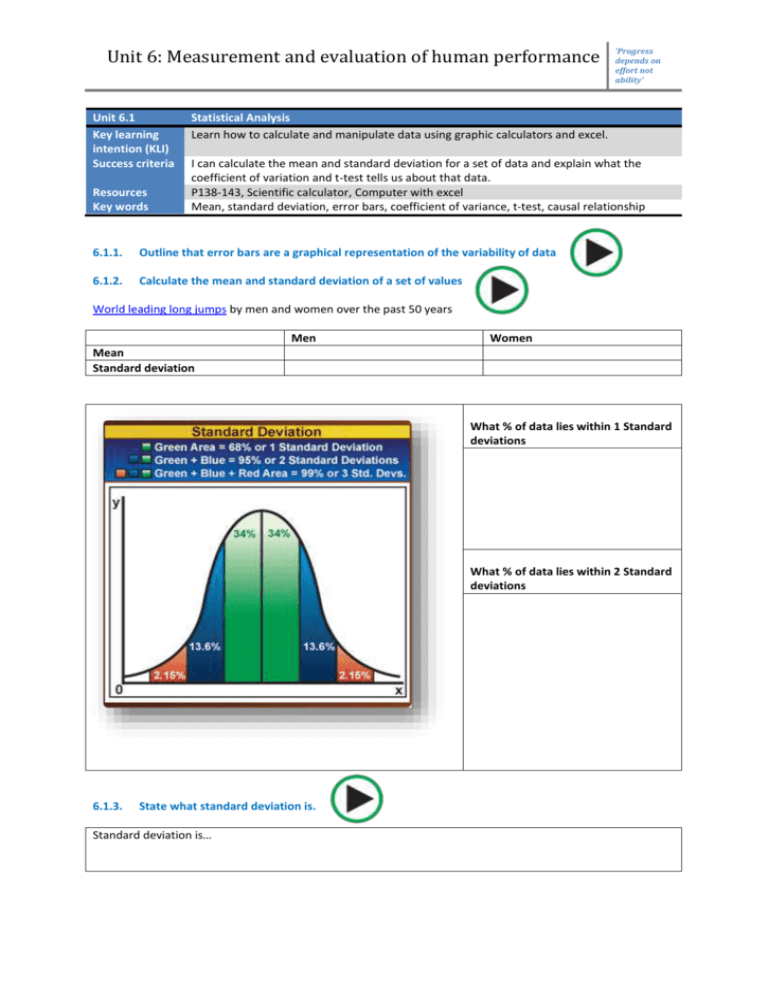
Unit 6: Measurement and evaluation of human performance Unit 6.1 Key learning intention (KLI) Success criteria Resources Key words ‘Progress depends on effort not ability’ Statistical Analysis Learn how to calculate and manipulate data using graphic calculators and excel. I can calculate the mean and standard deviation for a set of data and explain what the coefficient of variation and t-test tells us about that data. P138-143, Scientific calculator, Computer with excel Mean, standard deviation, error bars, coefficient of variance, t-test, causal relationship 6.1.1. Outline that error bars are a graphical representation of the variability of data 6.1.2. Calculate the mean and standard deviation of a set of values World leading long jumps by men and women over the past 50 years Men Women Mean Standard deviation What % of data lies within 1 Standard deviations What % of data lies within 2 Standard deviations 6.1.3. State what standard deviation is. Standard deviation is… Unit 6: Measurement and evaluation of human performance ‘Progress depends on effort not ability’ A________________ standard deviation indicates that the data is clustered closely around the mean value. Conversely, a ________________ standard deviation indicates a wider spread around the mean . 6.1.4. State how SD is useful for comparing the means and the spread of data between two or more samples Track and field challenge. We are going to compare the performances of all members of the class. You have one practice go, and then you must record your next 10 jumps. We will collect everybody’s results, calculate their mean and SD and discuss what the results may mean. Use error bars to display this information. Have fun! Copy and paste your table into the space on the next page Stick your excel table here with your long jump scores and calculated mean and SD. Graph the data using error bars. Unit 6: Measurement and evaluation of human performance 6.1.5. ‘Progress depends on effort not ability’ Outline the meaning of co-efficient of variance Coefficient of variation (V) The ratio of the standard deviation to the mean expressed as a percentage. V= 100 x SD Mean Now calculate the coefficient of variation for each member of the class for their mean long jump distance. Copy and paste the table below. What do the results show? 6.1.6. Deduce the significance of the difference between two sets of data using calculated values for t and the appropriate tables. t-test It can be used to determine if two sets of data are significantly different from each other. Two-tailed t-test Paired t-test Unpaired t-test 6.1.7. Explain that the existence of a correlation does not establish that there is a causal relationship between two variables. Can you think of any examples in your sport? Unit 6: Measurement and evaluation of human performance Unit 6.1 Key learning intention (KLI) Success criteria Resources Key words ‘Progress depends on effort not ability’ Statistical Analysis Learn how to calculate and manipulate data using graphic calculators and excel. I can calculate the mean and standard deviation for a set of data and explain what the coefficient of variation and t-test tells us about that data. P138-143, Scientific calculator, Computer with excel Mean, standard deviation, You have finished unit 1.1. You should now be able to achieve the success criteria above. How about some quick revision before you complete the end of unit assessment. Now go to edmodo and complete the end of unit assessment. If you score more than 90% you can move onto the next unit. Feedback will be given within 24 hours.
