Evolution Notes Document - CLICK ME!
advertisement
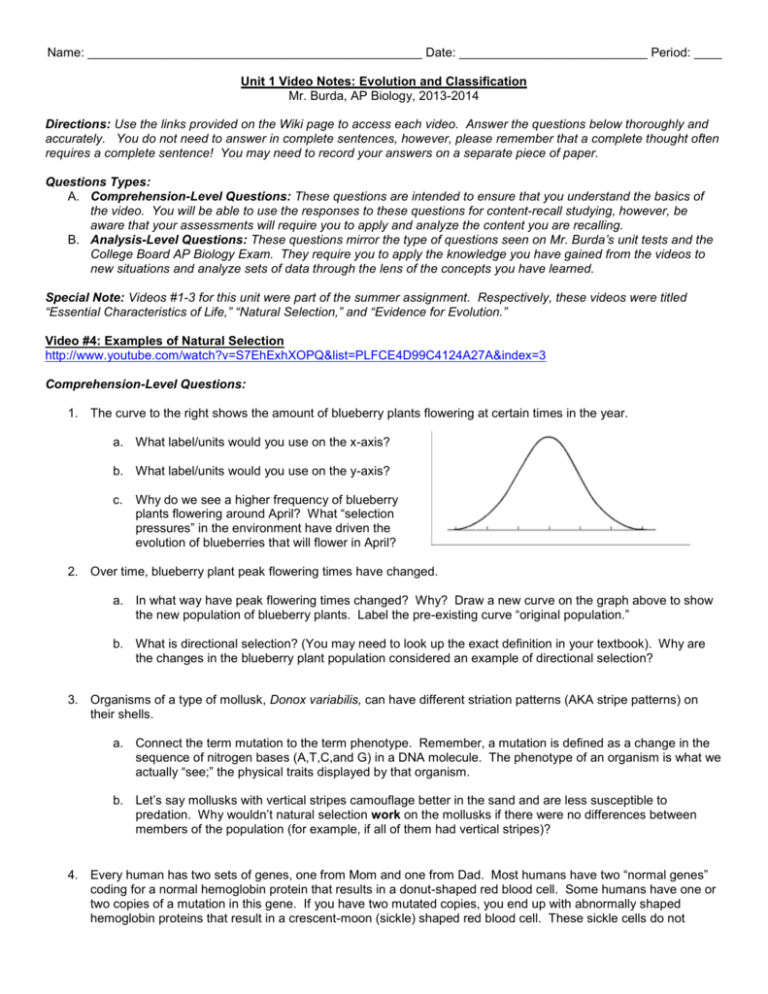
Name: ________________________________________________ Date: ___________________________ Period: ____ Unit 1 Video Notes: Evolution and Classification Mr. Burda, AP Biology, 2013-2014 Directions: Use the links provided on the Wiki page to access each video. Answer the questions below thoroughly and accurately. You do not need to answer in complete sentences, however, please remember that a complete thought often requires a complete sentence! You may need to record your answers on a separate piece of paper. Questions Types: A. Comprehension-Level Questions: These questions are intended to ensure that you understand the basics of the video. You will be able to use the responses to these questions for content-recall studying, however, be aware that your assessments will require you to apply and analyze the content you are recalling. B. Analysis-Level Questions: These questions mirror the type of questions seen on Mr. Burda’s unit tests and the College Board AP Biology Exam. They require you to apply the knowledge you have gained from the videos to new situations and analyze sets of data through the lens of the concepts you have learned. Special Note: Videos #1-3 for this unit were part of the summer assignment. Respectively, these videos were titled “Essential Characteristics of Life,” “Natural Selection,” and “Evidence for Evolution.” Video #4: Examples of Natural Selection http://www.youtube.com/watch?v=S7EhExhXOPQ&list=PLFCE4D99C4124A27A&index=3 Comprehension-Level Questions: 1. The curve to the right shows the amount of blueberry plants flowering at certain times in the year. a. What label/units would you use on the x-axis? b. What label/units would you use on the y-axis? c. Why do we see a higher frequency of blueberry plants flowering around April? What “selection pressures” in the environment have driven the evolution of blueberries that will flower in April? 2. Over time, blueberry plant peak flowering times have changed. a. In what way have peak flowering times changed? Why? Draw a new curve on the graph above to show the new population of blueberry plants. Label the pre-existing curve “original population.” b. What is directional selection? (You may need to look up the exact definition in your textbook). Why are the changes in the blueberry plant population considered an example of directional selection? 3. Organisms of a type of mollusk, Donox variabilis, can have different striation patterns (AKA stripe patterns) on their shells. a. Connect the term mutation to the term phenotype. Remember, a mutation is defined as a change in the sequence of nitrogen bases (A,T,C,and G) in a DNA molecule. The phenotype of an organism is what we actually “see;” the physical traits displayed by that organism. b. Let’s say mollusks with vertical stripes camouflage better in the sand and are less susceptible to predation. Why wouldn’t natural selection work on the mollusks if there were no differences between members of the population (for example, if all of them had vertical stripes)? 4. Every human has two sets of genes, one from Mom and one from Dad. Most humans have two “normal genes” coding for a normal hemoglobin protein that results in a donut-shaped red blood cell. Some humans have one or two copies of a mutation in this gene. If you have two mutated copies, you end up with abnormally shaped hemoglobin proteins that result in a crescent-moon (sickle) shaped red blood cell. These sickle cells do not transport oxygen through the arteries and veins effectively and they often clog these blood vessels, resulting in pain and increased risk of heart attack or stroke (see image to the right). a. If you have only one copy of the mutated gene and one normal gene you are considered “heterozygous.” Individuals with one copy are considered “more fit” than individuals with two normal copies or two mutated copies. Why is this? Why did nature “select” for the “heterozygous condition?” b. Why is the sickle cell gene form most common in Africa? c. Would natural selection work differently in areas with no malaria? What changes would we see in the frequency of the sickle cell allele in an area where people have little to no risk of contracting malaria? 5. Tuberculosis is a lung disease caused by a rod-shaped (AKA bacillus) bacteria species called Mycobacterium tuberculosis. These bacteria feed on lung tissue and can cause issues with respiration and coughing fits. We can kill off most of the bacteria using antibiotics, but some bacteria have genes that allow them to be naturally resistant to antibiotics. In the presence of antibiotics, these bacteria survive and reproduce better than non-resistant bacteria, so you end up with a population comprised of only resistant bacteria. This is called “multi-drug resistant tuberculosis.” a. Why does Mr. Anderson say that humans are “selecting” the trait of antibiotic resistance in bacteria? b. When antibiotics were first introduced around the time of World War II, the most popular antibiotics were called “sulfa drugs.” Bacteria quickly became resistant to sulfa drugs, but some scientists argue that we should start using these older drugs to treat modern infections. What is their rationale for this argument? Analysis-Level Questions: 6. The shape and height of a tortoise’s shell influence how high the tortoise can raise its head. A tortoise with a high shell that leaves a large gap can raise its head higher than a tortoise with a lower shell and a smaller gap. In a population of herbivorous tortoises, a shift in the frequency of different shell heights is observed over time. A set of graphs representing the change in frequency of the different shell heights is shown to the right. Provide an example of an environmental selection pressure that could cause the changes in the frequencies of different shell heights. 7. Dandelions are weeds that are very common in many grassy areas of Texas. Dandelion flowers first open up in a bright-yellow stage, and later turn a fluffy white when they are ready to release their seeds. The seeds are carried by the wind, and can sometimes travel great distances before landing and growing into new plants. Dandelion stems are usually very long, typically about 20–30 centimeters (cm). A science teacher discovered an area in her lawn where nearly every dandelion had a stem less than 1 cm long. These short dandelions were replacing large amounts of grass in the lawn surrounding her house. They were growing much more thickly than the taller dandelions in other nearby areas. The short dandelions appeared to be growing very successfully in one area of her lawn, but did not appear to have spread to other areas of her lawn. The science teacher noticed that every time she mowed her lawn, the short dandelions were left untouched by the mower blades, and that their numbers were steadily increasing. a. Why aren’t the short dandelions spreading to other parts of the lawn? b. Are the short dandelions truly more “fit” than the tall dandelions? (Remember: To be considered fit, an organism must be better able to survive AND reproduce than other members of the population). a. Outline the relationship between daylength and latitude for the larval populations in 1972. b. Compare the data of 1972 with 1996. c. Explain how the data illustrates an evolutionary response to a longer growing season due to a later onset of winter. Daylength to enter hibernation / hr 8. (Former International Baccalaureate Question) The mosquito (Wyeomyia smithii) uses daylength as a guide to either continue development of its larvae or to begin hibernation. This response to daylength is genetically controlled. Longer daylengths maintain development whereas shorter daylengths induce hibernation. In the northern regions of the northern hemisphere, even though daylengths are longer, winter arrives earlier than in regions closer to the equator. The following data is from an experiment to determine if W. smithii has adapted to later onsets of winter as a consequence of global warming. In 1972 and 1996, larvae were collected at various locations in the United States at latitudes 30–50° North. The larvae were examined to determine what daylength induced hibernation. Each circle on the following graph represents one larval population. 16 15 1972 14 1996 13 12 30 Equator 35 40 45 Latitude /º 50 55 North Pole Video #5: Evolution Continues http://www.youtube.com/watch?v=fCu1RVq40QI&list=PLFCE4D99C4124A27A Comprehension-Level Questions: 1. How is artificial selection (ex: with dog breeds) different from natural selection? 2. Describe what happened to the frequencies of various beak depths in the Galapagos finches following the 1977 drought. Why did Peter and Rosemary Grant consider this an example of directional selection? 3. Over time, the original Galapagos finch population has gone through disruptive selection to produce the many species with various beak sizes/shapes that we see today. What does this mean? 4. What is stabilizing selection? What example does Mr. Anderson use to describe stabilizing selection? 5. How is sexual selection (ex: with male peacock “trains”) different from natural selection? Analysis-Level Questions: 6. The guppy (Poecilia reticulata) is a small fish commonly found in Trinidad. In an experiment, male guppies were divided into those with a lot of colour (bright) and those with little colour (dull). They were also exposed to a predator to see if they approached it (brave) or swam away from it (timid). Female guppies were allowed to select males to mate with, in the presence and absence of predators. The bar chart summarizes their choice of males. [Source: J G Godin and L A Dugatkin, (1996), Proc. National Academy Science, USA, 93, pages 10262–10267] a. State how many females chose dull male guppies with a predator present. b. Calculate the difference in timid bright males chosen by the females with and without the predator present. c. Compare mate selection by females in the presence and absence of a predator. Can the traits chosen by females due to sexual selection depend on factors in the environment (ex: predators)? Video #6: Genetic Drift http://www.youtube.com/watch?v=mjQ_yN5znyk&list=PLFCE4D99C4124A27A&index=4 Comprehension-Level Questions: A Little Background Information: Every person has 46 chromosomes, which each consist of a long DNA double helix super-coiled into a more condensed form. A baby receives 23 chromosomes from his mother and 23 chromosomes from his father. For each chromosome from Mom, there is an identical chromosome from Dad with the same types of genes in the same places. These pairs of identical maternal and paternal chromosomes are called homologous chromosomes. A gene is a segment of DNA found on a chromosome that codes for a particular trait. Alleles are the different possible forms of a gene. For example, for an eye color gene, there may be a blue eye allele, a green eye allele, a brown eye allele, etc. Every person has two alleles for each gene (one on each homologous chromosome). One allele for a particular gene may be “dominant” and the other may be “recessive.” A dominant allele will “cover up” the other allele. For example, if the brown eye allele is dominant to the blue eye allele, a baby that receives one copy of each will have brown eyes. We usually use capital letters (ex: B) to represent the dominant allele and lowercase letters (ex: b) to represent the recessive allele. We call the combination of alleles found in a person’s cell for a particular gene that person’s genotype. Our brown-eyed baby would have the genotype “Bb.” We call this genotype “heterozygous,” since “hetero” means “different.” In other words, the baby has two DIFFERENT alleles (B and b) for the eye color gene. A “homozygous” genotype is one in which the baby has two of the same allele. BB and bb are two examples of homozygous genotypes. The actual physical trait seen in the baby is called the “phenotype.” The phenotype is determined by the genotype. Below is a chart showing possible genotypes and associated phenotypes for the eye color gene. Genotype Description Homozygous Dominant Heterozygous Homozygous Recessive Genotype Letters BB Bb bb Phenotype Brown Brown Blue The image to the right shows two homologous chromosomes with alleles for three different genes—P, A, and B. The genotype letters and descriptions are given below the chromosome images. Connections to Evolution: Evolution is defined as the change in allele frequencies within a population over generations. An individual cannot change his/her genes, but over time we may find that we have increasingly higher brown-eyed people than blue-eyed people due to natural selection or random chance. (In other words, the frequency of the brown eye allele may be higher in your generation than your grandparents’ generation. This indicates that evolution has taken place.) Sometimes a factor in the environment may allow brown-eyed individuals to survive and reproduce better and we will see evolution of eye color as a result of natural selection. Sometimes, however, changes in allele frequencies are completely random and due to chance. We call these random changes genetic drift. Scientists often use calculations to track changes in allele frequencies over time. They use the letter “p” to represent the frequency of the dominant allele for a particular gene. This frequency is a value from 0-1, where 1 means that the dominant allele is “fixed.” 100% of individuals within that population would have two dominant alleles. Scientists use the letter “q” to represent the frequency of the recessive allele for a particular gene. Again, this frequency is a value from 0-1. If there are only two alleles for that particular gene, the frequencies of p and q must add to 1. (Note: it is important to understand that just because an allele is dominant doesn’t mean it will be more frequent in a population.) In the Video: Mr. Anderson’s first example involves a population of 20 organisms. We will call them “Woobles” (I don’t know, I’m weird…) There is one gene that controls Wooble body color, and the allele for red color (R) is dominant to the allele for blue color (r). Therefore, p represents the frequency of the red allele and q represents the frequency of the blue allele. In the first generation, there are 10 homozygous red Woobles (genotype = RR) and 10 blue Woobles (genotype = rr), so the values of p and q are as follows: p = 0.5 and q = 0.5. 1. Mr. Anderson gives some POSSIBLE random changes in allele frequencies over the next few generations as Woobles randomly mate with one another. Record the new allele frequencies for each generation in the chart below. Generation p Value q Value 1 (Original) 0.5 0.5 2 3 4 5 What has happened to the red allele by generation 5? Draw the graph given by Mr. Anderson to show the changes in the p and q values over several generations. Make sure to label your axes, create a key, and provide an appropriate title. 2. When an allele reaches a frequency of 1.0 (or 100%), we say that it has become “fixed” in the population’s gene pool (i.e., the only allele present). When an allele reaches a frequency of 0.0 (or 0%), we say that it has been “lost” from the population’s gene pool. When Mr. Anderson run’s his internet simulation with populations of different sizes, what do you notice about the tendency of alleles to become fixed or lost in a large population (500 individuals) vs. a small population (50 individuals)? In other words, is there more genetic drift in a large population or a small population? (Remember: genetic drift involves random changes in allele frequencies… if there are major random changes like an allele becoming fixed or lost, this indicates a very high amount of genetic drift taking place). 3. In his first example, Mr. Anderson discusses the bottleneck effect. This occurs when some disaster drastically reduces the size of a population, and increases the chance of random changes in the gene pool (genetic drift). Due to overhunting and habitat loss, the size of the Northern Elephant Seal population in Mexico dropped drastically from a few hundred thousand seals to around 50. What effect did this population bottleneck have on the genetic diversity (the number of different alleles in the gene pool) in the population? 4. How did this loss of genetic diversity in the Northern Elephant Seals affect the symmetry of their skulls? What evidence does Mr. Anderson provide to support this claim? 5. In his second example, Mr. Anderson discusses the founder effect. This occurs when a small group of individuals from the original population colonizes a new isolated area (typically an island). This initially reduces the size of the gene pool from the large original population to the small migrant population. In the 1700s, on the island of Pingelap, a typhoon swept through and killed all but 20 people (including their colorblind leader). Technically, this is an example of the bottleneck effect since the loss of genetic diversity was the result of a natural disaster. However, we will use it as an example of the founder effect, since the resulting population was incredibly isolated so no new genes could move in as a result of newcomers to the island. Over several generations, what happened to the population on Pingelap as a result of the colorblind leader surviving the typhoon? Analysis-Level Questions: A population of finches and their relative fitness is shown in the data table below. Finches with large beaks are represented by the genotype BB, finches with medium-sized beaks are represented by the genotype Bb, and finches with small-sized beaks are represented by the genotype bb. This particular finch population lives in an environment where large and small seeds are abundant. 6. Which of the following statements about the finches’ fitness is supported by the data shown in the diagram above? a. A population of all small-beaked finches will have high fitness, but not as high as the medium-beaked finches’ fitness. b. Medium-beaked finches will have the lowest fitness level in this environment due to a lack of mediumsized seeds. c. Allele frequency of the large-beaked trait will continue to increase in this environment. d. The small-beaked finches are susceptible to genetic drift and will eventually decrease in number in the population. Follow-Up Question: Which answer did you circle? Why did you select this answer? Video #7: Phylogenetics http://www.youtube.com/watch?v=fQwI90bkJl4&list=PLFCE4D99C4124A27A&index=8 Comprehension-Level Questions: 1. Phylogenetics is defined as the study of the evolutionary history of groups of organisms. A phylogenetic tree is a branched diagram showing the relationships between groups of organisms. What is taxonomy? How is it related to phylogenetics? 2. What is speciation? How do we know if two organisms are no longer in the same species? 3. What two types of evidence do scientists use to construct phylogenetic trees that accurately depict evolutionary relationships? 4. Darwin proposed the idea that all modern organisms have “common descent.” What did he mean by this? 5. What do branch points on a phylogenetic tree represent? 6. Morphological Evidence: For each animal group given in the chart below, identify the number of chambers found in the heart and describe how the heart works to circulate blood to the oxygen-providing tissues (ex: gills or lungs) and the body tissues. Animal Group Fish # of Heart Chambers Description of Blood Circulation Through the Heart and Body Amphibians and Reptiles Birds and Mammals Why did amphibians / reptiles need to evolve a three-chambered heart? Why did birds / mammals need to evolve a four-chambered heart? 7. In the space below, complete the phylogenetic tree showing the relationships between fish, amphibians, reptiles, birds, and mammals based on heart structure. Place the name of one group at the end of each “branch.” ? Ancestor ? ? ? ? 8. Molecular Evidence: What types of molecules can we compare to determine how closely related groups of organisms are to one another? 9. A cladogram is a specific type of phylogenetic tree. A cladogram organizes groups of organisms into “clades.” How does Mr. Anderson define a clade? 10. Synapomorphies are often used as evidence when constructing cladograms. Define synapomorphy and provide an example from the video. 11. The terms monophyletic group and clade are synonymous. How are paraphyletic and polyphyletic groups different from clades? Analysis-Level Questions: 12. River dolphins live in freshwater habitats or estuaries. They have a number of features in common which distinguish them from other dolphins: long beaks, flexible necks, very good echo-location and very poor eyesight. Only four families of river dolphin have been found in rivers around the world. River Amazon, Brazil La Plata, Argentina The Yangtze, China The Indus and Ganges, India River Dolphin Family Iniidae Pontoporiidae Lipotidae Platanistidae Evolutionary biologists have tried to determine how closely related these river dolphins are to one another. River dolphins are members of the group the toothed whales. Three lines of evidence were analysed producing three cladograms (family trees) for all the toothed whales. The evidence to construct these cladograms came from the morphology (form and structure) of fossil toothed whales (I), the morphology of living toothed whales (II) and the molecular sequences from living toothed whales (III) I Morphology of fossils Physeteridae Ziphiidae Squalodontidae Platanistidae Squalodelphidae Eurhinodelphidae Lipotidae Iniidae Pontoporiidae Monodontidae Phocoenidae Delphinidae II Morphology of living animals III Molecular sequences Physeteridae Mysticeti Ziphiidae Physeteridae Platanistidae Ziphiidae Lipotidae Iniidae Pontoporiidae Monodontidae Platanistidae Delphinoidae Lipotidae Phocoenidae Iniidae Delphinidae Pontoporiidae [Source: H Hamilton, et al., (2001) Proc R Soc Lond B, 268 pages 549–556] a. Suggest a reason why there are more families present in cladogram I, produced from the morphology of fossils, than for the other cladograms. b. Using only the data from cladogram III, identify which other family of river dolphins is most closely related to Mysticeti c. The tree using the data from the morphology of living animals (II) indicates that the families are more closely related than the tree using molecular sequences (III) from the same animals. Explain how these dolphins can look so similar when in fact they may not be so closely related. d. These cladograms show the species that share common ancestors but do not show how long ago they diverged from one another. Outline further evidence that would be needed to determine when these families of toothed whales diverged. 13. Molecular and radioactive dating of fossils are used to determine the phylogeny of organisms. Turtles are organisms with a long evolutionary history, making them an ideal group to study. Below is a phylogeny of some turtle genera developed using both fossil and molecular dating. Carettochelys Apalone Lissemys Chelonia Dermochelys Chelydra Dermatemys Staurotypus Sternotherus Platysternon Emys Graptemys Trachemys Geochelone Mauremys Heosemys JURASSIC 206.0 CRETACEOUS 144.0 CENOZOIC 65.0 Age / mya MODERN 2.5 0 [Source: Thomas J. Near, Peter A. Meylan, and H. Bradley Shaffer, ‘Assessing Concordance of Fossil Calibration Points in Molecular Clock Studies: An Example Using Turtles’, The American Naturalist (Feb 2005), vol. 165, issue 2, pp. 137–146. Copyright © 2008. University of Chicago Press.] a. Identify the oldest turtle genus. b. Compare the phylogeny of Chelonia with Graptemys. Video #8: Speciation and Extinction http://www.youtube.com/watch?v=yJLRl2G41nQ&list=PLFCE4D99C4124A27A Comprehension-Level Questions: 1. How does Mr. Anderson compare the terms “speciation” and “extinction”? 2. What usually causes adaptive radiation—extreme speciation that produces many new species in a short amount of time? 3. Explain how the appearance of different types of three-spined stickleback fish in Loberg Lake represents an example of speciation. 4. Why is “low armor” considered an adaptive trait in Loberg Lake? 5. At what point do we know that low-armored and full-armored stickleback populations are no longer the same species? 6. Why did adaptive radiation occur among the Hawaiian Honeycreepers? 7. What major event allowed for the adaptive radiation of mammals? 8. Scientists have identified five mass extinctions in evolutionary history. What makes a mass extinction different from a typical extinction event? 9. What is one environmental change that may have caused the loss of many dinosaur species during the K-T Extinction (Cretaceous-Tertiary Extinction)? What evidence do scientists have to support this theory? Analysis-Level Questions: 10. The mechanisms of speciation in ferns have been studied in temperate and tropical habitats. One group of three species from the genus Polypodium lives in rocky areas in temperate forests in North America. Members of this group have similar morphology (form and structure). Another group of four species from the genus Pleopeltis live at different altitudes in tropical mountains in Mexico and Central America. Members of this group are morphologically distinct. Data from the different species within each group was compared in order to study the mechanisms of speciation. Genetic identity was determined by comparing the similarities of certain proteins and genes in each species. Values between 0 and 1 were assigned to pairs of species to indicate the degree of similarity in genetic identity. A value of 1 would mean that all the genetic factors studied were identical between the species being compared. [Source: C Haufler, E Hooper and J Therrien, (2000), Plant Species Biology, 15, pages 223–236] a. Compare the geographic distributions of the two groups. b. Identify, giving a reason, which group, Polypodium or Pleopeltis, is most genetically diverse. c. Identify the two species that are most similar genetically. d. Suggest how the process of speciation could have occurred in Polypodium. e. Explain which of the two groups has most probably been genetically isolated for the longest period of time. Video #9: Speciation http://www.youtube.com/watch?v=rlfNvoyijmo&list=PLFCE4D99C4124A27A Comprehension-Level Questions: 1. Reproductive isolation can cause speciation. Reproductive isolation occurs when two groups of organisms that were originally from the same species cannot or will not interbreed with one another. Thus, they cannot be considered the same species. Explain how the Diane Dodds experiment demonstrates speciation due to reproductive isolation. 2. Explain the difference between pre-zygotic and post-zygotic examples of reproductive isolation, making sure to define the term “zygote” in your answer. 3. What is geographic isolation? Is this a cause of allopatric or sympatric speciation? Explain your answer. 4. Describe the example Mr. Anderson gives to demonstrate allopatric speciation. 5. Define temporal isolation. Is this an example of prezygotic or postzygotic isolation? What example does Mr. Anderson give to show temporal isolation? 6. Define mechanical isolation. Is this an example of prezygotic or postzygotic isolation? What example does Mr. Anderson give to show mechanical isolation? 7. Define behavioral isolation. Is this an example of prezygotic or postzygotic isolation? What example does Mr. Anderson give to show behavioral isolation? 8. Define zygote mortality. Is this an example of prezygotic or postzygotic isolation? What example does Mr. Anderson give to show zygote mortality. 9. Define hybrid sterility. Is this an example of prezygotic or postzygotic isolation? What example does Mr. Anderson give to show hybrid sterility? 10. What is gene flow? Why does reduced gene flow between two populations of the same species cause speciation? 11. Rates of Speciation: Explain the difference between the two theories regarding the rates of speciation in nature – gradualism and punctuated equilibrium. Make sure to refer to the graphs to the right and describe the trends shown in each graph with respect to the x and y axis. 12. According to Steven Jay Gould (the major proponent of punctuated equilibrium), what causes the quick bursts of evolution/speciation? ***Note: Please ignore the section of the video regarding “polyploidy.” We will discuss this in our classical genetics unit.*** Analysis-Level Questions: 13. Many organisms use pheromones (chemical signals) to communicate with each other. These pheromones are unique mixtures of chemicals that are typically species-specific. The way in which different species’ pheromones have evolved has caused debate among investigators. Some scientists believe that gradual evolution (gradualism) of pheromones has occurred while others believe that pheromone evolution occurs through sudden major shifts (punctuated equilibrium). The pheromone components of 34 species of bark beetle from three genera, Dendroctonus, Ips and Orthotomicus were analysed. The data below compares the distribution of pheromone components to an established phylogeny for three genera. Symonds and Elgar, “The mode of pheromone evolution: evidence from bark beetles”, Proceedings of the Royal Society London B (22 April 2004) vol. 271, issue 1514, pages 839-846, © The Royal Society a. List the two most common pheromone components of bark beetles. b. Analyse how the pheromone components of D. pseudotsugae, D. simplex, and D. rufipennis illustrate a close phylogenetic relationship. c. Adjacent species connected with a bracket ( |__| ) show the closest evolutionary relationship. Deduce whether adjacent species of Dendroctonus show gradual change or sudden major shifts in pheromone evolution. Video #10: Abiogenesis http://www.youtube.com/watch?v=W3ceg--uQKM&list=PLFCE4D99C4124A27A Comprehension-Level Questions: 1. Spontaneous generation is the theory that living organisms can be “born” from non-living / inanimate objects. How did the maggot (baby fly) and meat experiment disprove the theory of spontaneous generation? 2. Describe how the conditions on primitive/early Earth were different from the conditions on earth today. 3. To understand how life first began on Earth, we need a little review from Biology 1. All cells are made up of four types of large molecules (AKA macromolecules)— carbohydrates, lipids, nucleic acids, and proteins. Each of these large molecules is made up of small building blocks called monomers. The monomers link together to create the polymer or macromolecule. Scientists believe that early Earth conditions could have created the first amino acids – monomers for proteins. Stanley Miller and Harold Urey devised an experiment to test this theory. The apparatus for the experiment is shown to the right. Explain how Miller and Urey used this apparatus to show the synthesis of amino acids from early Earth conditions. 4. What types of living organisms do scientists believe evolved first? Were they animals, plants, fungi, bacteria, etc? ***Note: Please ignore the section of the video regarding “genes first vs. metabolism first.”*** Analysis-Level Questions: 5. A meteorite that struck near Murchison, Australia was analysed for the presence of amino acids. Similar studies have been carried out on liquid samples taken from the Miller-Urey discharge experiment. The table below summarizes the results from both sources. Each dot represents a relative amount of a particular amino acid, with one dot representing a small amount and eight dots representing a large amount. Amino Acid Glycine Alanine α-amino-N-butyric Acid α-aminoisobutyric Acid Valine Norvaline Isovaline Proline Pipecolic Acid Aspartic Acid N-ethylglycine Sarcosine Murchison Meteorite Miller-Urey Experiment [Source: C Mitchell, Life in the Universe, (1995), W H Freeman, pages 46–47] a. Compare the amino acids found on the meteorite with those produced in the Miller-Urey experiment. Refer to named examples. b. Suggest a conclusion from your comparison. Video #11: The Origin of Life – Scientific Evidence http://www.youtube.com/watch?v=SWY3FKbtEz8&list=PLFCE4D99C4124A27A Comprehension-Level Questions: 1. Geological Evidence: Why is the appearance of photosynthesizing bacteria an important step in the history of life on Earth? 2. Geological Evidence: Where do humans show up on the geologic time scale? 3. Chemical Evidence: Why do we call the 25 amino acids synthesized in the Miller / Urey experiment “old” amino acids? 4. Molecular Evidence: Identify the characteristics common to all organisms, meaning they are found in the LUA (last universal ancestor). ***Note: Please ignore everything after the 11 minute mark. This information is not part of the College Board AP Biology curriculum.*** Analysis-Level Questions: There are no analysis-level questions for this particular video.


