Figures and Tables
advertisement

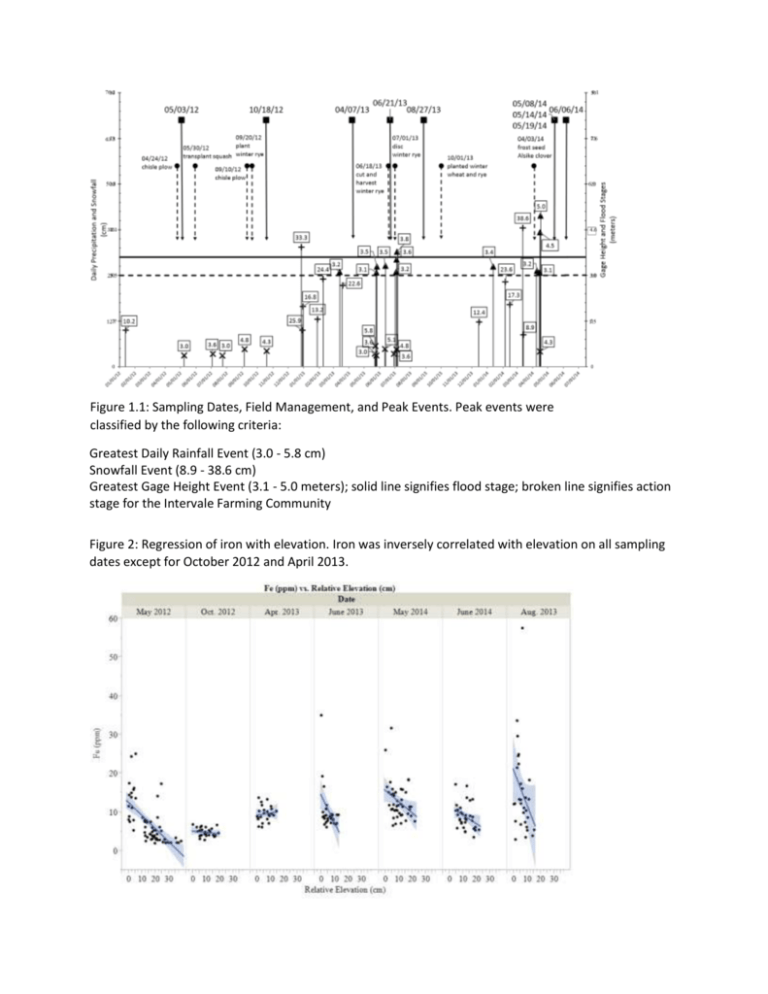
Figure 1.1: Sampling Dates, Field Management, and Peak Events. Peak events were classified by the following criteria: Greatest Daily Rainfall Event (3.0 - 5.8 cm) Snowfall Event (8.9 - 38.6 cm) Greatest Gage Height Event (3.1 - 5.0 meters); solid line signifies flood stage; broken line signifies action stage for the Intervale Farming Community Figure 2: Regression of iron with elevation. Iron was inversely correlated with elevation on all sampling dates except for October 2012 and April 2013. May June Elevation Depression 1 Depression 2 Depression 3 Depression 4 Figure 3: Phosphorus distributions across four depressions in the study field. The images show that P is almost inversely related to elevation, i.e. low elevations seem to match up with high MME-P. However, in some areas MME-P is more aligned with the slopes of the depression. Table 1: Statistical Parameter Estimates for Moisture Distribution in Depression 1. Also listed are parameters of linear regression between moisture and elevation in Depression 1 by sampling date. Letter by mean values denote significant difference when letters are different. Significance levels of linear regressions are indicated by asterisks * <0.1, ** <0.05, ***p<0.001. Percent Moisture Date n Mean Std CV(%) Linear Regression Parameters Slope Intercept SE R2 P(t) May 2012◊ 60 40.28a 4.23 10.51 - 0.116 42.13 0.05 0.08 0.0278** Oct. 2012◊ 27 36.56b 1.91 5.21 - 0.172 38.21 0.07 0.20 0.0206** Apr. 2013‡ 24 38.15c 1.31 3.43 - 0.128 38.93 0.06 0.35 0.0464** June 2013‡ 30 31.75d 1.56 4.91 - 0.154 32.67 0.77 0.12 0.0562* May 2014‡ 43 35.17e 1.80 5.11 - 0.230 37.46 0.04 0.49 <0.0001*** Aug. 2013† 30 28.36f 1.17 4.12 - 0.114 29.10 0.05 0.15 0.0364** June 2014† 33 29.49g 0.59 1.99 - 0.008 29.59 0.02 0.001 0.7066 Table 2: Statistical Parameter Estimates for Phosphorus Distribution. Also listed are parameters of linear regression between MME-phosphorus concentrations and MMEiron concentrations in Depression 1 by sampling date. Letter by mean values denote significant difference when letters are different. . Significance levels of linear regressions are indicated by asterisks * <0.1, ** <0.05, ***p<0.001. MME-P on Post Irene and Peak Events are significantly different from non-Peak events. In most cases, the non-peak events are low except for in May 2012 when it was lower. At this point in time the soil had been flooded for a couple of months. Phosphorus (ppm) Date n Mean Std CV (%) Linear Regression Parameters Slope Intercept SE R2 P(t) May 2012◊ 60 2.18a 0.82 37.49 + 0.071 1.68 0.02 0.23 <0.0001*** Oct. 2012◊ 27 4.70bc 2.31 49.27 + 0.446 2.58 0.42 0.04 0.2993 Apr. 2013‡ 24 4.56bd 1.76 38.75 + 0.319 1.49 0.17 0.14 0.0766* June 2013‡ 30 4.82cd 1.60 33.21 + 0.140 3.43 0.05 0.23 0.0080** May 2014‡ 43 3.84b 0.31 8.12 + 0.018 3.62 0.01 0.08 0.0732* Aug. 2013† 30 3.04e 0.85 28.02 + 0.011 2.88 0.01 0.02 0.4426 June 2014† 33 3.26e 0.28 8.48 - 0.006 3.32 0.02 0.01 0.6894 Table 3: May 2014: Statistical Parameter Estimates for Phosphorus Distribution. Also listed are parameters of linear regression between MME-phosphorus and MME - iron in Depressions 1-4 and Scattered Set. Letter by mean values denote significant difference when letters are different. . Significance levels of linear regressions are indicated by asterisks * <0.1, ** <0.05, ***p<0.001. Phosphorus (ppm) Date n Mean Std CV (%) Linear Regression Parameters Slope Intercept SE R2 P(t) Dep. 1 43 3.84a 0.31 8.12 + 0.018 3.62 0.01 0.08 0.0732* Dep. 2 39 3.77a 0.37 9.84 + 0.010 3.68 0.03 0.00 0.6904 Dep. 3 33 2.86b 0.30 10.62 + 0.001 2.82 0.01 0.00 0.8981 Dep. 4 33 3.77a 0.52 13.85 - 0.060 4.22 0.03 0.10 0.0816* Scattered 19 2.88b 0.39 13.51 - 0.001 2.90 0.01 0.00 0.9043 Table 4: June 2014: Statistical Parameter Estimates for Phosphorus Distribution. Also listed are parameters of linear regression between MME-phosphorus and MME-iron in Depressions 1-4 and Scattered Set. Letter by mean values denote significant difference among means are denoted by different letters. There were no significant linear regressions suggesting that the inverse relationship breaks down as soils dry. Phosphorus (ppm) Date n Mean Std CV (%) Linear Regression Parameters Slope Intercept SE R2 P(t) Dep. 1 33 3.26a 0.28 8.48 - 0.006 3.32 0.02 0.01 0.6894 Dep. 2 32 3.93b 0.24 6.17 + 0.013 3.79 0.01 0.03 0.3344 Dep. 3 33 3.15a 0.31 9.89 + 0.005 3.01 0.01 0.02 0.3855 Dep. 4 32 3.77b 0.61 16.25 - 0.009 3.85 0.01 0.01 0.5886 Scattered 19 3.13a 0.44 14.12 + 0.009 3.00 0.01 0.040 0.4196 Table 5: Statistical Parameter Estimates for Manganese Distribution. Also listed are parameters of linear regression between MME-manganese and elevation in Depression 1 by sampling Date. Letter by mean values denote significant difference when letters are different. Significance levels of linear regressions are indicated by asterisks * <0.1, ** <0.05, ***p<0.001. Manganese (ppm) Date n Mean Std CV (%) Linear Regression Parameters Intercept Slope SE R2 P(t) May 2012◊ 60 4.07a 0.55 13.64 - 0.014 4.29 0.01 0.07 0.0416** Oct. 2012◊ 27 4.85b 0.54 11.08 + 0.023 4.62 0.02 0.05 0.2845 Apr. 2013‡ 24 38.14c 6.14 16.24 + 0.151 36.87 0.31 0.01 0.6302 June 2013‡ 30 63.90d 33.40 52.27 - 5.650 97.76 1.41 0.37 0.0004** May 2014‡ 43 33.50e 28.21 84.20 - 2.785 61.23 0.68 0.29 0.0002** Aug. 2013† 30 27.14f 3.07 11.30 + 0.106 26.44 0.15 0.02 0.4711 June 2014† 33 25.11e 6.28 24.99 - 0.301 28.65 0.23 0.05 0.1948 Table 6: May 2014: Statistical Parameter Estimates for Manganese Distribution. Also listed are parameters of linear regression between MME-manganese and elevation in Depressions 1-4 and Scattered Set. Letter by mean values denote significant difference when letters are different. Significance levels of linear regressions are indicated by asterisks * <0.1, ** <0.05, ***p<0.001. Date n Manganese (ppm) Mean Std Linear Regression Pa CV(%) Slope Intercept SE rameters R2 P(t) Dep. 1 43 33.50a 28.21 84.20 - 2.785 61.23 0.68 0.29 0.0002** Dep. 2 39 29.46b 8.66 29.38 - 1.831 35.85 0.54 0.24 0.0017** Dep. 3 33 50.35c 17.92 35.59 - 3.250 66.38 0.85 0.32 0.0006** Dep. 4 33 34.09b 15.25 44.74 - 2.636 44.59 1.07 0.16 0.0194** Scattered 19 41.40b 25.66 61.99 + 2.002 20.04 1.08 0.17 0.0819* Table 7: June 2014: Statistical Parameter Estimates for Manganese Distribution. Also listed are parameters of linear regression between MME-manganese and elevation in Depressions 1-4 and Scattered Set. Letter by mean values denote significant dfferences when letters are di erent. Significance levels of linear regressions are indicated by asterisks * <0.1, ** <0.05, ***p<0.001. Manganese (ppm) Date Linear Regression Parameters n Mean Std CV(%) Slope Intercept SE R2 P(t) Dep. 1 33 25.11a 6.28 24.99 - 0.301 28.65 0.23 0.05 0.1948 Dep. 2 32 24.26a 4.18 17.23 - 0.256 25.14 0.32 0.02 0.4259 Dep. 3 33 39.65b 8.37 21.10 - 2.158 50.30 0.29 0.65 <0.0001*** Dep. 4 32 39.15c 29.31 74.86 - 4.057 55.46 2.13 0.11 0.0669* Scattered 19 28.01c 4.70 16.77 + 0.389 27.60 0.22 0.00 0.8599


