Draft health and wellbeing indicators March
advertisement
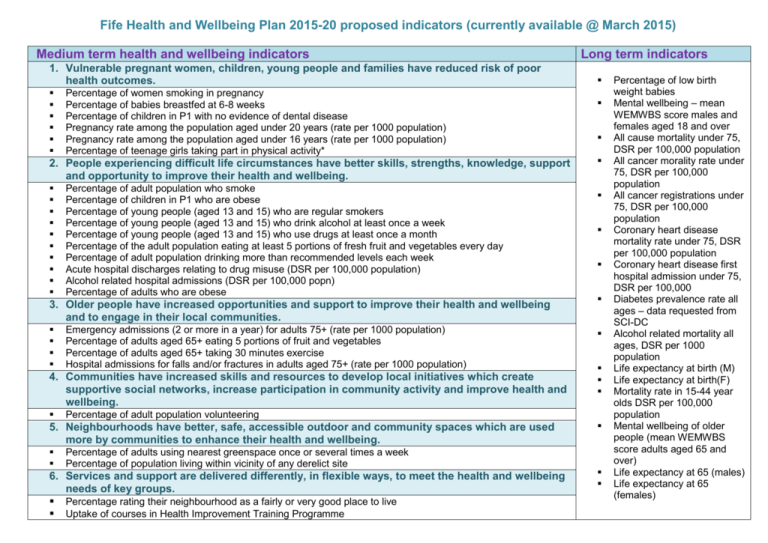
Fife Health and Wellbeing Plan 2015-20 proposed indicators (currently available @ March 2015) Medium term health and wellbeing indicators 1. Vulnerable pregnant women, children, young people and families have reduced risk of poor health outcomes. Percentage of women smoking in pregnancy Percentage of babies breastfed at 6-8 weeks Percentage of children in P1 with no evidence of dental disease Pregnancy rate among the population aged under 20 years (rate per 1000 population) Pregnancy rate among the population aged under 16 years (rate per 1000 population) Percentage of teenage girls taking part in physical activity* 2. People experiencing difficult life circumstances have better skills, strengths, knowledge, support and opportunity to improve their health and wellbeing. Percentage of adult population who smoke Percentage of children in P1 who are obese Percentage of young people (aged 13 and 15) who are regular smokers Percentage of young people (aged 13 and 15) who drink alcohol at least once a week Percentage of young people (aged 13 and 15) who use drugs at least once a month Percentage of the adult population eating at least 5 portions of fresh fruit and vegetables every day Percentage of adult population drinking more than recommended levels each week Acute hospital discharges relating to drug misuse (DSR per 100,000 population) Alcohol related hospital admissions (DSR per 100,000 popn) Percentage of adults who are obese 3. Older people have increased opportunities and support to improve their health and wellbeing and to engage in their local communities. Emergency admissions (2 or more in a year) for adults 75+ (rate per 1000 population) Percentage of adults aged 65+ eating 5 portions of fruit and vegetables Percentage of adults aged 65+ taking 30 minutes exercise Hospital admissions for falls and/or fractures in adults aged 75+ (rate per 1000 population) 4. Communities have increased skills and resources to develop local initiatives which create supportive social networks, increase participation in community activity and improve health and wellbeing. Percentage of adult population volunteering 5. Neighbourhoods have better, safe, accessible outdoor and community spaces which are used more by communities to enhance their health and wellbeing. Long term indicators Percentage of adults using nearest greenspace once or several times a week Percentage of population living within vicinity of any derelict site 6. Services and support are delivered differently, in flexible ways, to meet the health and wellbeing needs of key groups. Percentage rating their neighbourhood as a fairly or very good place to live Uptake of courses in Health Improvement Training Programme Percentage of low birth weight babies Mental wellbeing – mean WEMWBS score males and females aged 18 and over All cause mortality under 75, DSR per 100,000 population All cancer morality rate under 75, DSR per 100,000 population All cancer registrations under 75, DSR per 100,000 population Coronary heart disease mortality rate under 75, DSR per 100,000 population Coronary heart disease first hospital admission under 75, DSR per 100,000 Diabetes prevalence rate all ages – data requested from SCI-DC Alcohol related mortality all ages, DSR per 1000 population Life expectancy at birth (M) Life expectancy at birth(F) Mortality rate in 15-44 year olds DSR per 100,000 population Mental wellbeing of older people (mean WEMWBS score adults aged 65 and over) Life expectancy at 65 (males) Life expectancy at 65 (females)
