Gummy Bear Lab
advertisement
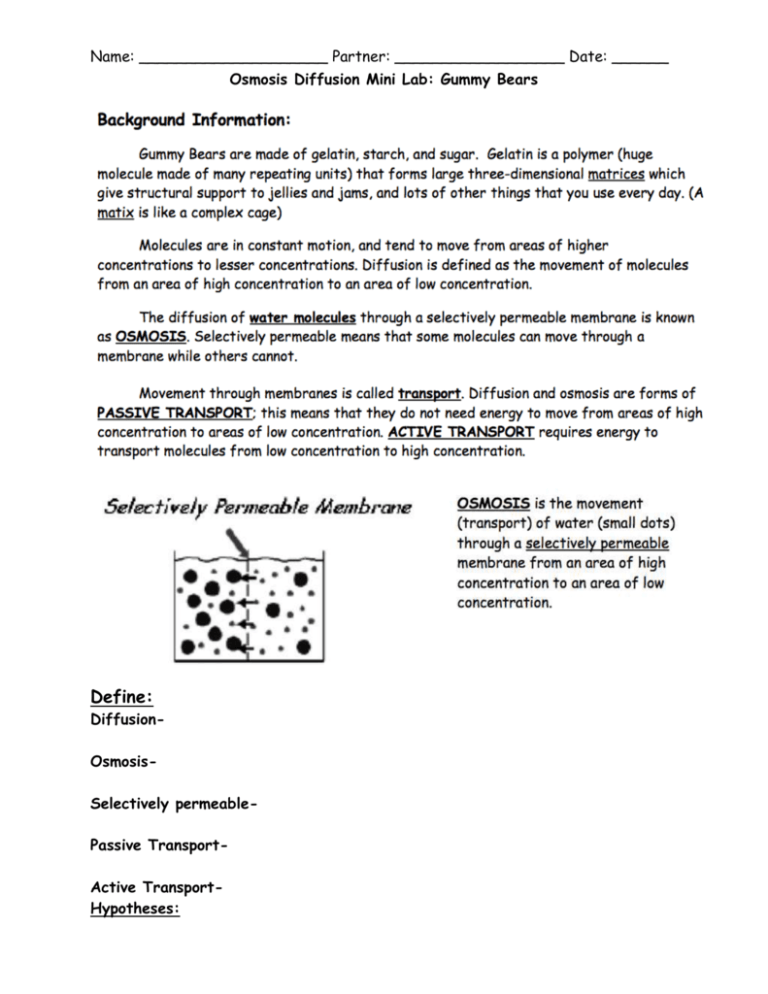
Name: ____________________ Partner: __________________ Date: ______ Osmosis Diffusion Mini Lab: Gummy Bears Define: DiffusionOsmosisSelectively permeablePassive TransportActive TransportHypotheses: Name: ____________________ Partner: __________________ Date: ______ 1. 2. If the H2O concentration in salt water is (higher, lower) than the H20 concentration in a Gummy Bear, then Gummy Bears placed in salt water will (increase, decrease, remain the same) size. Circle your answer. 3. What do you think will happen if you place a pre-soaked gummy bear (soaked in plain water, or 0% salt) in a container of salt water? ______________________ _____________________________________________________________ Procedure: 1. Obtain 3 small white cups, and label the following: 0%, 15%, 15% (PS) Note: The “PS” references that the gummy bear has been “pre-soaked” 2. Obtain two dry gummy bears and take their measurements as follows: Quantitative Data Day 1 Gummy Bear 1 (Dry) Gummy Bear 2 (Dry Gummy Bear 3 (PS) Height (mm): Length (mm): Width (mm): Mass (g): Qualitative observations of dry gummy bears (1 & 2): Qualitative observations of pre-soaked gummy bear (3): 3. Obtain a third, pre-soaked gummy bear, and take its measurements above. 4. Measure out 30 mL of each liquid concentration (0, 15%, 15%) and place into the corresponding cups. 5. Place one dry gummy bear in the 0% and 15% respectively. Then place the pre-soaked gummy bear in the 15% PS solution. 6. Let sit overnight. Name: ____________________ Partner: __________________ Date: ______ 7. Calculate Volume and Density for each bear as follows… Volume = length x width x height Density = mass/ volume Day 1 Gummy Bear 1 (Dry) Gummy Bear 2 (Dry Gummy Bear 3 (PS) Mass (g): Volume (mm3): Density (g/ mm3): 8. When you place a dry sponge on a puddle of water, it immediately mops up the puddle. Using your knowledge of osmosis, explain why this is the case: ______________________________________________________________ ______________________________________________________________ ______________________________________________________________ ______________________________________________________________ ______________________________________________________________ ______________________________________________________________ 9. Describe what happened during each of these events and why… Name: ____________________ Partner: __________________ Date: ______ 10. Day 2 Data Charts Day 2 Gummy Bear 1 (Dry) Gummy Bear 2 (Dry Gummy Bear 3 (PS) Height (mm): Length (mm): Width (mm): Mass (g): 11. Use the following calculations to complete the table below: Volume = length x width x height Density = mass/ volume Day 2 Gummy Bear 1 (Dry) Gummy Bear 2 (Dry Gummy Bear 3 (PS) Gummy Bear 1 (Dry) Gummy Bear 2 (Dry Gummy Bear 3 (PS) Mass (g): Volume (mm3): Density (g/ mm3): Day 1 Volume Day 2 Volume Day 1 Density Day 2 Density 12. Compare the volume and density from Day 1 and Day 2, and using your knowledge of osmosis and diffusion, describe why the volume and density changed as it did for each gummy bear (1, 2, and 3). See next page Name: ____________________ Partner: __________________ Date: ______ Trend Analysis Directions: Answer the questions below. 1.How did the initially dry gummy bear (#1) change after sitting in 0% salt solution? _________________________________________________________________________________________________________ _________________________________________________________________________________________________________ _________________________________________________________________________________________________________ _________________________________________________________________________________________________________ 2. How did the initially dry gummy bear (32) change after sitting in 15% salt solution? _________________________________________________________________________________________________________ _________________________________________________________________________________________________________ _________________________________________________________________________________________________________ _________________________________________________________________________________________________________ 3. How did the pre-soaked gummy bear (#3) change after sitting in the 15% salt solution? _________________________________________________________________________________________________________ _________________________________________________________________________________________________________ _________________________________________________________________________________________________________ _________________________________________________________________________________________________________ 4. How does this experiment represent the relationship between osmosis and hypo/hypertonic environments? Use data from your lab to support your answer. _________________________________________________________________________________________________________ _________________________________________________________________________________________________________ _________________________________________________________________________________________________________ _________________________________________________________________________________________________________ _________________________________________________________________________________________________________ _________________________________________________________________________________________________________ _________________________________________________________________________________________________________ _________________________________________________________________________________________________________ _________________________________________________________________________________________________________
