Titanic Tragedy III
advertisement
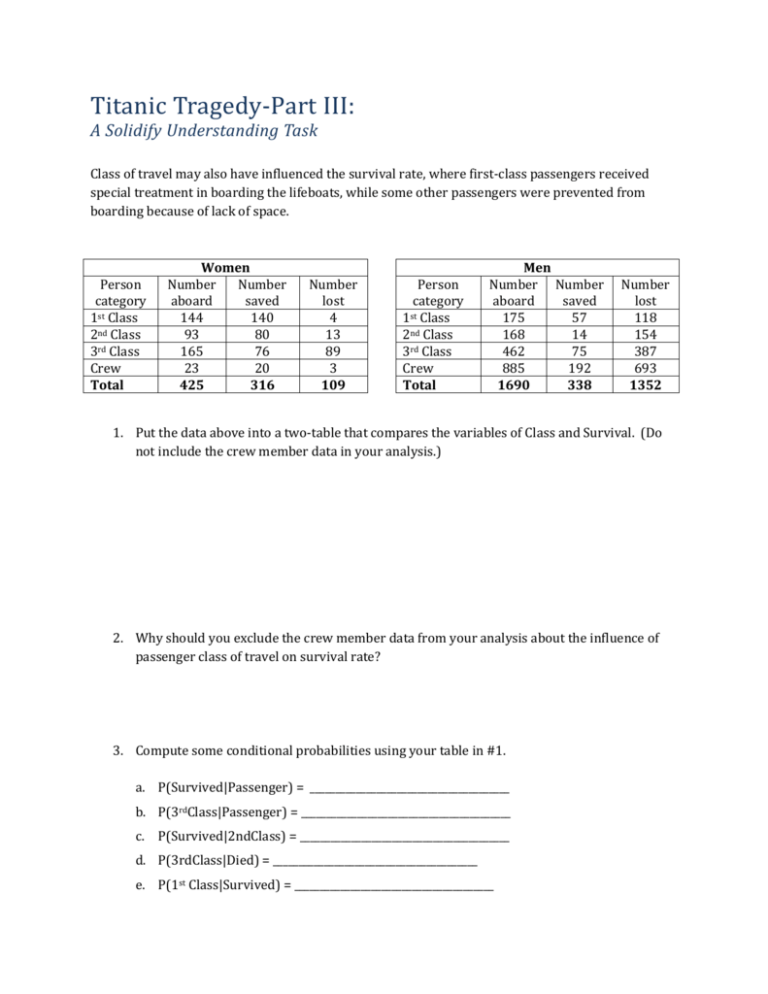
Titanic Tragedy-Part III: A Solidify Understanding Task Class of travel may also have influenced the survival rate, where first-class passengers received special treatment in boarding the lifeboats, while some other passengers were prevented from boarding because of lack of space. Person category 1st Class 2nd Class 3rd Class Crew Total Women Number Number aboard saved 144 140 93 80 165 76 23 20 425 316 Number lost 4 13 89 3 109 Person category 1st Class 2nd Class 3rd Class Crew Total Men Number Number aboard saved 175 57 168 14 462 75 885 192 1690 338 Number lost 118 154 387 693 1352 1. Put the data above into a two-table that compares the variables of Class and Survival. (Do not include the crew member data in your analysis.) 2. Why should you exclude the crew member data from your analysis about the influence of passenger class of travel on survival rate? 3. Compute some conditional probabilities using your table in #1. a. P(Survived|Passenger) = _______________________________________ b. P(3rdClass|Passenger) = _________________________________________ c. P(Survived|2ndClass) = _________________________________________ d. P(3rdClass|Died) = ________________________________________ e. P(1st Class|Survived) = _______________________________________ 4. The conditional probability of two events A and B can also be calculated as follows: P(A|B) = P(A and B)/P(B) Use this relationship to check your answers to #3 above. Clearly show how you used the boldface equation in each case. a. P(Survived|Passenger) = b. P(3rdClass|Passenger) = c. P(Survived|2ndClass) = d. P(3rdClass|Died) = e. P(1st Class|Survived) = 5. Was the survival rate of the passengers independent from their class of travel? Give evidence to show that class of travel was or was not independent from survival rate. 6. The independence of two variables A and B means that their joint probability (P(A and B)) is equal to the product of their marginal probabilities—P(A)P(B). Use this idea to create a two-way table that uses the same marginal probabilities as #1, but which clearly demonstrates that class and survival are independent of one another. Titanic Tragedy-Part III: – Teacher Notes A Solidify Understanding Task Purpose: Students will practice their understanding of how to test for independence between variables, given data in a two-way table. They will apply it in a situation larger than a 2 by 2 table. Core Standards Focus: S.CP.2: Understand that two events A and B are independent if the probability of A and B occurring together is the product of their probabilities, and use this characterization to determine if they are independent. S.CP.3: Understand the conditional probability of A given B as P(A and B)/P(B), and interpret independence of A and B as saying that the conditional probability of A given B is the same as the probability of A, and the conditional probability of B given A is the same as the probability of B. S.CP.4: Construct and interpret two-way frequency tables of data when two categories are associated with each object being classified. Use the two-way table as a sample space to decide if events are independent and to approximate conditional probabilities. For example, collect data from a random sample of students in your school on their favorite subject among math, science, and English. Estimate the probability that a randomly selected student from your school will favor science given that the student is in tenth grade. Do the same for other subjects; compare the results. Related Standards: S.CP.5 Launch (Whole Class): Prompt the whole class: “Do you think that survival on the Titanic only depended on gender, or could there have been other variables upon which survival depended?” Allow a minute of consultation with a partner, then take ideas in popcorn fashion from the partnerships until all ideas have been collected. You should hear such things as “being a member of the crew or not” and “the class of the passenger” and perhaps other variables that do not figure in our data. Explore (Small Group): Distribute Titanic Tragedy Part III. As you monitor student work on the task, look for different choices made by groups for their two-way tables in #1. They might use 1) counts, 2) fractions, or 3) percentages in the cells of the table (although they should not mix the forms). As an informal assessment see if students can describe in words the meanings of particular cells in their tables (e.g. “the number of 1st class passengers that died” or “the fraction of passengers that were 3rd class). Insist that students write down how they computed the conditional probabilities in #3. Note that, although passengers are only a portion of the original data, they should comprise the entirety of the data table that students constructed in #1, so that P(Survived|Passenger) = P(Survived) for the studentgenerated table (but not the original one). Here are standard responses: Counts 1st Class 2nd Class 3rd Class TOTAL Survived 197 94 151 442 Died 122 167 476 765 TOTAL 319 261 627 1207 Fractional Probabilities 1st Class 2nd Class 3rd Class TOTAL Survived Died TOTAL 197/1207 94/1207 151/1207 442/1207 122/1207 167/1207 476/1027 765/1207 319/1207 261/1207 627/1207 1207/1207 Percentage Probabilities 1st Class 2nd Class 3rd Class TOTAL Survived Died TOTAL 16.3% 7.8% 12.5% 36.6% 10.1% 13.9% 39.4% 63.4% 26.4% 21.7% 51.9% 100% Decimal Probabilities 1st Class 2nd Class 3rd Class TOTAL Survived Died TOTAL 0.163 0.078 0.125 0.366 0.101 0.139 0.394 0.634 0.264 0.217 0.519 1.000 a. P(Survived|Passenger) = P(Survived and Passenger)/P(Passenger) = 0.366/1 = 0.366 b. P(3rdClass|Passenger) = P(3rd Class and Passenger)/P(Passenger) = 0.519/1 = 0.519 c. P(Survived|2ndClass) = P(Survived and 2ndClass)/P(2ndClass) = 0.078/0.217 = 0.36 d. P(3rdClass|Died) = P(3rdClass and Died)/P(Died) = 0.394/0.634 = 0.62 e. P(1st Class|Survived) = P(1stClass and Survived)/P(Survived) = 0.163/0.366 = 0.45 Also, select and sequence student work on the question of independence of class and survival. You might sequence the groups from most informal arguments to most formal mathematical arguments or based on the mode of representation used. Discuss (Whole Class): Allow students from groups using different choices in their tables to display their tables for comparison. Encourage the class to specify what are the advantages of each choice. The class may come up with a variety of ideas here, but be sure that the idea that the probability version makes it quicker to assess independence comes out. Have a pair of students come to the board and write out their work on 3c and 4c, and lead a short discussion of the two methods that arrived at the same answer. Bring up students to present their work on the independence of class and survival in the sequence you’ve selected (#5 and #6). Make sure that two ideas are highlighted: 1) The idea that independence requires that the conditional probabilities equal, more or less, the unconditional probabilities—that is, that P(A | B) = P(A) and P(B|A) = P(B). This will be evident in most groups work on #5. 2) The idea that independence requires that the joint probability equals, more or less, the product of the marginal probabilities—that is, P(A and B) = P(A)P(B) when A and B are independent. If it hasn’t been surfaced in discussing #5, this is the explicit target of #6. Here’s the correct version for #6: Probabilities 1st Class 2nd Class 3rd Class TOTAL Survived 0.097 0.079 0.190 0.366 Died 0.167 0.138 0.329 0.634 TOTAL 0.264 0.217 0.519 1.000 Note that in Secondary III students will build statistical inference upon a comparison of actual data (such as table in #1) with an idealized set of data as if the variables were perfectly independent (such as table in #6). They will ask the question of how different does the actual data have to be from the ideal in order to infer that the variables show a dependence upon one another.
