Supplementary methods Scan specifications High
advertisement
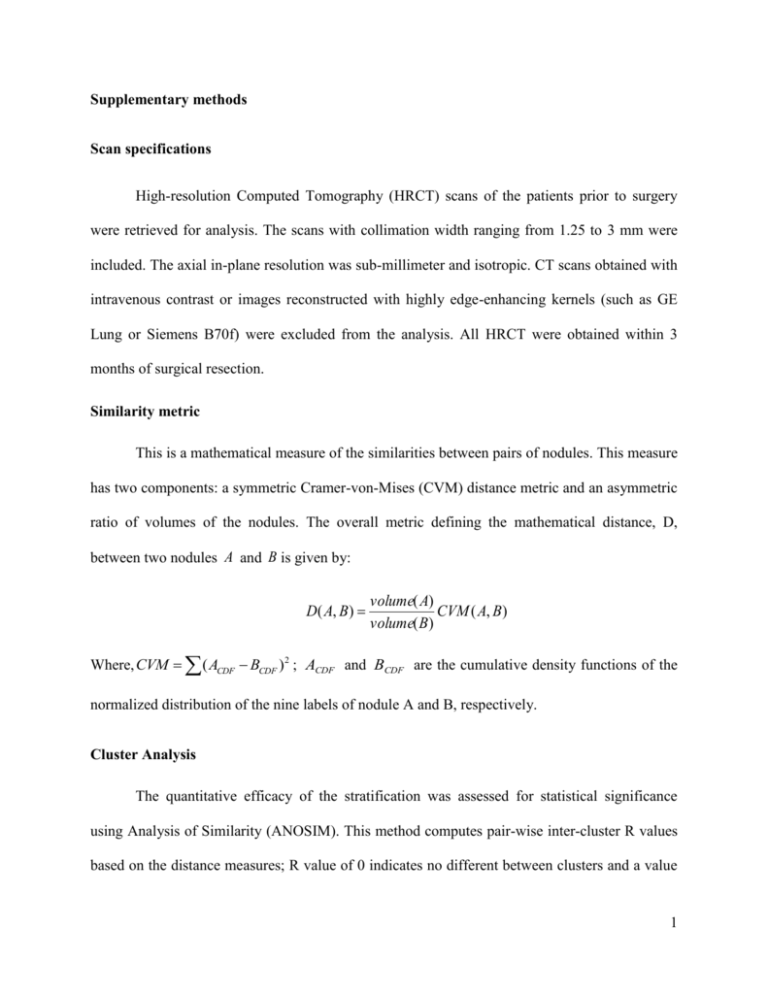
Supplementary methods Scan specifications High-resolution Computed Tomography (HRCT) scans of the patients prior to surgery were retrieved for analysis. The scans with collimation width ranging from 1.25 to 3 mm were included. The axial in-plane resolution was sub-millimeter and isotropic. CT scans obtained with intravenous contrast or images reconstructed with highly edge-enhancing kernels (such as GE Lung or Siemens B70f) were excluded from the analysis. All HRCT were obtained within 3 months of surgical resection. Similarity metric This is a mathematical measure of the similarities between pairs of nodules. This measure has two components: a symmetric Cramer-von-Mises (CVM) distance metric and an asymmetric ratio of volumes of the nodules. The overall metric defining the mathematical distance, D, between two nodules A and B is given by: D( A, B) volume( A) CVM ( A, B) volume( B) Where, CVM ( ACDF BCDF ) 2 ; ACDF and BCDF are the cumulative density functions of the normalized distribution of the nine labels of nodule A and B, respectively. Cluster Analysis The quantitative efficacy of the stratification was assessed for statistical significance using Analysis of Similarity (ANOSIM). This method computes pair-wise inter-cluster R values based on the distance measures; R value of 0 indicates no different between clusters and a value 1 of 1 suggests the clusters are completely different. A combined R value is average of the pairwise inter-cluster R values. Internal Validation of Stratification We validated the consistency of categorization using leave-one-out (LOO) and k-fold (k = 10) cross validation (CV) techniques. In LOO CV, iteratively one nodule was excluded and clustering was performed to identify new exemplars. Subsequently, the excluded nodule was categorized vis-à-vis the exemplars. Similarly, in 10-fold CV, ten nodules were simultaneously excluded. 2
