Free Body Diagrams Worksheet
advertisement
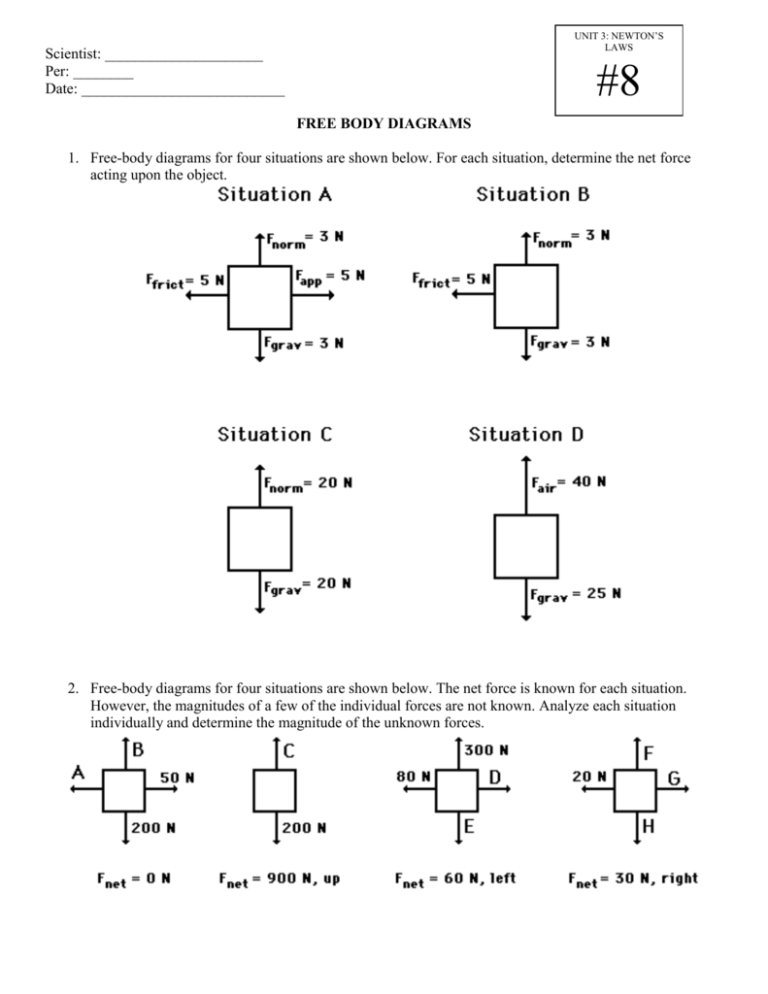
UNIT 3: NEWTON’S LAWS Scientist: _____________________ Per: ________ Date: ___________________________ #8 FREE BODY DIAGRAMS 1. Free-body diagrams for four situations are shown below. For each situation, determine the net force acting upon the object. 2. Free-body diagrams for four situations are shown below. The net force is known for each situation. However, the magnitudes of a few of the individual forces are not known. Analyze each situation individually and determine the magnitude of the unknown forces. 3. A book is at rest on a table-top. A free-body diagram for this situation looks like this: 4. A girl is suspended motionless from a bar which hangs from the ceiling by two ropes. A free-body diagram for the girl in this situation looks like this: 5. An egg is free-falling from a nest in a tree. Neglect air resistance. A free-body diagram for this situation looks like this: 6. A flying squirrel is gliding (no wing flaps) from a tree to the ground at constant velocity. Consider air resistance. A free-body diagram for this situation looks like this: 7. A rightward force is applied to a book in order to move it across a desk with a rightward acceleration. Consider frictional forces. Neglect air resistance. A free-body diagram for this situation looks like this: 8. A rightward force is applied to a book in order to move it across a desk at constant velocity. Consider frictional forces. Neglect air resistance. A free-body diagram for this situation looks like this: 9. A college student rests a backpack upon his shoulder. The pack is suspended motionless by one strap from one shoulder. A free-body diagram for the backpack in this situation looks like this: 10. A skydiver is descending with a constant velocity. Consider air resistance. A free-body diagram for this situation looks like this: 11. A force is applied to the right to drag a sled across loosely-packed snow with a rightward acceleration. A free-body diagram for this situation looks like this: 12. A car is coasting to the right and slowing down. A free-body diagram for this situation looks like this:
