Supplementary_Material
advertisement
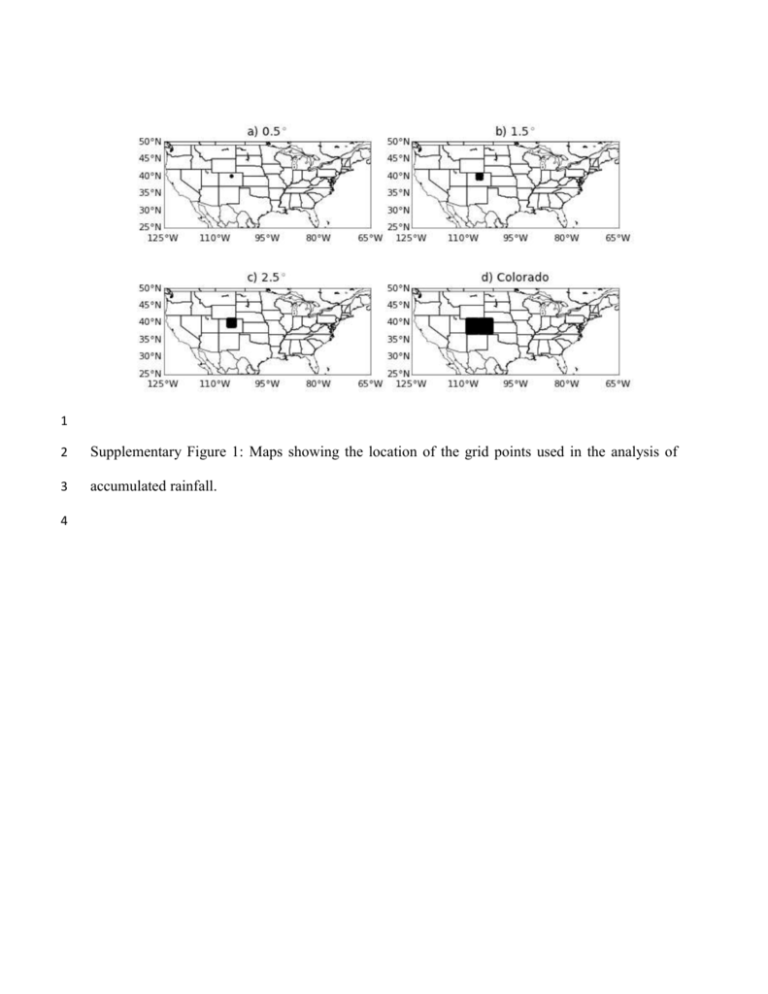
1 2 Supplementary Figure 1: Maps showing the location of the grid points used in the analysis of 3 accumulated rainfall. 4 5 6 Supplementary Figure 2: Fields of accumulated daily precipitation (in mm) from 10th to 15th 7 September 2013 in the observations (left column), in the ensemble mean forecast initialized at 8 12UTC 6th September 2013 (middle column), and in the ensemble mean forecast initialized at 9 12UTC 7th September 2013 (right column). (Note that precipitation on 10th September 2013 10 corresponds to an accumulation from 12UTC 9th September to 12UTC 10th September.) White 11 areas over the United States correspond to rainfall < 5 mm / day. 12 13 14 15 16 17 Supplementary Figure 3: Accumulated rainfall for the eight forecast initialization times (12UTC 18 5th to 12th September 2013) for the observations, eight models and ensemble mean for a 1.5° × 19 1.5° area surrounding Boulder Colorado. 20 21 Supplementary Figure 4: Accumulated rainfall for the eight forecast initialization times (12UTC 22 5th to 12th September 2013) for the observations, eight models and ensemble mean for the state of 23 Colorado. 24 25 Supplementary Table 1: Characteristics of the eight global climate models used in the analysis. 26 The 27 (http://tigge.ecmwf.int/models.html) accessed on 11th November 2013. model details were taken from the ECMWF TIGGE 28 Model CMA (China) CMC (Canada) Grid Resolution TL213L31 600×300 Gaussian global grid, L74 384×196 (0.9375 degrees), L28 Initialization Time Used 12 UTC 12 UTC Forecast length T+240h T+384h 12 UTC T+360h T639 (32 km) (010d) L62; T319 (63 km) (10-15d) L62. T319 (reduced linear Gaussian grid) L60. 12 UTC T+360h 12 UTC T+264h KMA (Korea) 0.5625° longitude by 0.375° latitude (Arakawa C grid) also referred to as N320, L80 12 UTC T+288h NCEP (USA) UKMO (UK) T126L28 0.8333° longitude by 0.5555° latitude (Arakawa C grid) also referred to as N216 L85 12 UTC 12 UTC T+384h T+360h CPTEC (Brazil) ECMWF (Europe) JMA (Japan) 29 website

