1 Bioelectric Signals and the Electrocaridogram Full
advertisement

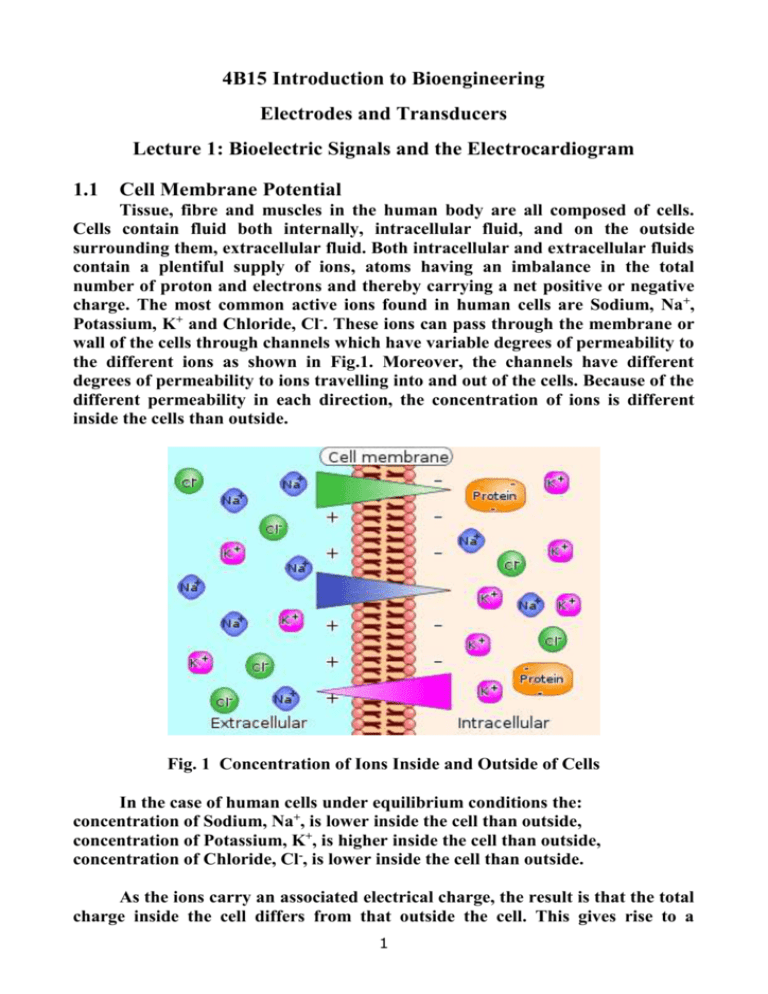
4B15 Introduction to Bioengineering Electrodes and Transducers Lecture 1: Bioelectric Signals and the Electrocardiogram 1.1 Cell Membrane Potential Tissue, fibre and muscles in the human body are all composed of cells. Cells contain fluid both internally, intracellular fluid, and on the outside surrounding them, extracellular fluid. Both intracellular and extracellular fluids contain a plentiful supply of ions, atoms having an imbalance in the total number of proton and electrons and thereby carrying a net positive or negative charge. The most common active ions found in human cells are Sodium, Na+, Potassium, K+ and Chloride, Cl-. These ions can pass through the membrane or wall of the cells through channels which have variable degrees of permeability to the different ions as shown in Fig.1. Moreover, the channels have different degrees of permeability to ions travelling into and out of the cells. Because of the different permeability in each direction, the concentration of ions is different inside the cells than outside. Fig. 1 Concentration of Ions Inside and Outside of Cells In the case of human cells under equilibrium conditions the: concentration of Sodium, Na+, is lower inside the cell than outside, concentration of Potassium, K+, is higher inside the cell than outside, concentration of Chloride, Cl-, is lower inside the cell than outside. As the ions carry an associated electrical charge, the result is that the total charge inside the cell differs from that outside the cell. This gives rise to a 1 difference in potential across the wall of the cell from inside to outside. This is known as the cell Membrane Potential, Em , and can be estimated by the Goldman Equation given as: 𝑹𝑻 𝑷𝑲 [𝑲+ ]𝒆𝒙𝒕 + 𝑷𝑵𝒂 [𝑵𝒂+ ]𝒆𝒙𝒕 + 𝑷𝑪𝒍 [𝑪𝒍− ]𝒊𝒏𝒕 𝑬𝒎 = 𝒍𝒏 ( ) 𝑭 𝑷𝑲 [𝑲+ ]𝒊𝒏𝒕 + 𝑷𝑵𝒂 [𝑵𝒂+ ]𝒊𝒏𝒕 + 𝑷𝑪𝒍 [𝑪𝒍− ]𝒆𝒙𝒕 where: R is the Universal Gas constant, 8.314 JK-1mol-1 T is the temperature in degrees Kelvin F is the Faraday constant, 96.5 x 10³ Cmol-1 Pi is the permeability of the cell membrane to the ith ion. [I±]loc is the concentration of the ith ion either inside or outside the cell. In animal and human cells this potential, which is measured across the cell membrane from inside to outside, is negative in polarity and has a value ranging from -40 to -100 mV, depending on the type of cell. It is close to -90 mV in most human cells. 1.2 Action Potential Many cells in the body, and in particular those associated with nerve and muscle fibres, can be excited either electrically or chemically. An electrochemical stimulus can induce changes in the permeability of the cell membrane to different ions and cause the cell to become active. This means that the flow of ions across the cell membrane changes abruptly and hence also the volume of charge on each side of the membrane. This is accompanied by a corresponding abrupt change in the trans-membrane potential so that the cell becomes depolarised, sometimes having a slight change in the potential in the opposite direction to its equilibrium state. The cell will eventually repolarise but usually at a slower rate than that at which it depolarises. This gives rise to the potential profile shown in Fig.2 known as the Action Potential. 2 Fig. 2 A Typical Action Potential Profile Once a cell becomes depolarised, the changes in the conditions surrounding the cell can act as a stimulus to adjacent cells and thereby a corresponding activation of these cells takes place also. In nerve and muscle cells the impulse generated by depolarisation of the cells can be passed from one cell to the next via axons and synapses, so that the stimulus passes along a nerve or muscle fibre as a wave with a repolarisation wave following behind as shown in Fig. 3. This allows impulses to cause contraction of muscles to induce intrinsic bodily actions, such as the movement of limbs and the beating of the heart. Fig. 3 The Transmission of Action Potentials 1.3 The Cardiovascular System The cardiovascular system of the human body is essentially one of the heart acting as a pump to force blood around the body. The blood acts as a transport system to carry oxygen, nutrients and chemical agents to all organs, limbs and tissue in the body as well as to transport waste products and toxins to organs for disposal. In fact, the heart actually operates as a double pump and the circulatory system consists of two separate circuits as shown in Fig. 4. He heart has four chambers, the left and right atria on top and the left and right ventricles on the bottom. Fig. 4 The Atria and Ventricles of the Human Heart 3 A simplified representation of the circulatory system is shown in Fig. 5. Blood is gathered from all parts of the body into the right atrium, from whence it is then transferred to the right ventricle. The right ventricle contracts to force blood out to the lungs where carbon dioxide is removed from it and fresh oxygen is absorbed. From the lungs the re-oxygenated blood travels back to the heart and into the left atrium. This loop is called the pulmonary circulation. Blood is then transferred to the right ventricle, which contracts with strength to force the blood out under pressure to all limbs and organs in the body. Once oxygen and nutrients have been distributed via the blood to nourish all of the cells around the body and waste products have been collected and delivered for excretion, the blood returns to the right atrium again. This second circuit is known as the systemic circulation. Fig. 5 The Heart and Circulatory System The continuous rhythmic pumping of the heart is caused by contractions of the muscles within the walls of each chamber which pumps blood from chamber to chamber and throughout the circulatory system. These cardiac rhythms are controlled by specific mechanisms operating within in the heart that transmit action potentials or electrical impulses along nerve fibres to the cells within the muscles in order to activate them at the appropriate points in the cardiac cycle. 4 Electro-stimulation of the Heart Fig.6 shows the main elements of the heart’s electro-conduction system. The sino-atrial (SA) node is a group of cells located in the upper right atrium. This node contains special electrochemically stimulated cells which depolarise and repolarise rhythmically without the need for external influence. Fig. 6 The Electro-conduction System of the Heart Once the trans-membrane potential in the cell reaches a certain threshold, the cell self-depolarises giving rise to an associated action potential, and then repolarises more gradually. It does this in a continuous and rhythmical manner, thus effectively providing the electrical oscillator which repeatedly generates the trigger stimulus to operate the nerve fibres of the heart and the muscles of the chambers to maintain a regular heartbeat. When the SA node ‘fires’, the resulting electrochemical stimulus spreads across the muscles in the walls of the right and left atria causing them to contract. Blood is consequently forced out of the atria and into the lower ventricles on both sides of the heart. The stimulus moves quickly from the sino-atrial node towards the atrio-ventricular (AV) node in approximately 30 - 50 ms. In order to allow the atria transfer their contents to the ventricles before the latter contract due to the approaching action potential, the AV node operates as a delay unit slowing down the transmission of the action potential by a further 110 ms before the stimulus is passed on by the AV node. The impulse is then transferred from the AV node towards the ventricles via a branch of fibres known as the Bundle of His which splits into left and right bundle branches as 5 shown in Fig. 4. Once the impulse reaches the left and right bundle branches it travels very quickly via the Purkinje Fibres which excite the muscles in the walls of the ventricles from the bottom upwards. The impulse can reach the furthest fibres just 60 ms after leaving the AV node. The action potential now causes ventricular contraction which forces the blood from the ventricles out into the pulmonary and systemic circulations. The excitation of such a large number of cells at the same time creates a significant electrical signal and a resulting electric field which is emitted outward from the heart to the surface of the body. These emanating electric signals can be detected using electrodes placed on the surface of the body i.e. on the subject's chest or limbs. The recorded electrical signal detected in this manner is what is known today as the Electrocardiogram or ECG signal. 1.4 The Electrocardiogram or ECG An idealised human ECG is shown in Fig. 7. It can be seen that there are several distinct components which make up the entire signal profile that is measured over a single complete cardiac cycle. The main components are identified as the P-wave, The QRS complex and the T-wave. Other segments and intervals which have a clinical importance from a diagnostic are defined. The amplitude of the QRS complex of a signal measured on a subject’s chest is typically between 1 – 5 mV. 6 Fig. 7 An Idealised ECG Human ECG Signal The different components of the ECG correspond to different events occurring in the heart over a cardiac cycle. The P wave is associated with the depolarisation of the cells in the muscles of the atria which cause the atria to contract and transfer blood to the ventricles. The QRS complex corresponds to the sharp depolarisation of the cells in the numerous and strong muscles of the ventricles. This period is known as ventricular systole. The repolarisation of the cells in the atrial muscles is masked by the QRS complex and cannot be observed independently. The T-wave corresponds to the repolarisation of the cells in the ventricular muscles during their resting phase known as ventricular diastole. The duration, shape and rhythm of these components and of the segments between them can provide invaluable insight into the state of the heart and the cardiovascular system. The earliest record of a functional ECG recording was presented by Willem Einthoven circa 1904. Einthoven originally used four jelled metal electrodes connected to the limbs of a subject for the recording process. It was later found that the electrodes could be moved to locations on the thorax without loss of signal strength. Einthoven developed the Leads known as the Einthoven triangle as shown in Fig. 8, comprising Lead I, II and III as indicated which represent different pairings of the electrodes, each providing a different aspect of the electrical activity in the heart. 7 Fig. 8 The ECG Einthoven Triangle Lead Configurations These lead configurations are measured as follows: Lead I = LA – RA Lead II = LL – RA Lead III = LL - LA By averaging the potential measured at the three main locations and using the resultant as a new reference, three additional lead configurations known as Augmented Leads can be obtained. Fig. 9. The Unipolar ECG V-Lead Configurations A further six leads, known as the unipolar V-leads, attached at a number of strategic locations around the chest give additional information on the electrical activity of the heart as shown in Fig. 9. A complete clinical ECG evaluation consists of measuring all twelve lead configurations. All of the points used to obtain these leads require electrodes of some sort to be connected to the body at the correct locations. 1.5 Electrodes Many biomedical measurements use electrodes. Typically, an electrode measures the electrical potential at a location on the surface of the body, usually relative to the potential at another location. They essentially perform the task of 8 converting the ionic current associated with electrical activity in the body into electronic current which is fed into the input of a recording amplifier. Electrodes are used most commonly in the measurement of: the Electrocardiogram or ECG, indicating cardiac activity, the Electroencephalogram or EEG, indicating brain activity, the Electromyogram or EMG, indicating muscle activity and the Electrooculogram or EOG, indicating activity in the eye. Originally the ECG was measured having the patient sitting with their limbs immersed in cylinders filled with electrolyte solution, into which large metal rod electrodes were placed which were then connected to the recording machine as shown in Fig. 10. Fig. 10. Early Electrocardiogram Recording by Einthoven Later, metallic strap-on types as shown in Fig. 11, which used a conductive paste to improve contact with the subject’s body were developed. These became smaller and more efficient with the metal eventually becoming Silver-SilverChloride for best results. 9 Fig. 11. Strap-on ECG Electrodes Present-day ECG electrodes are disposable, self-adhesive, pre-jelled types commonly used in clinics and hospital wards and come in various shapes and sizes as shown in Fig. 12. Examples of Electrodes in use for other measurements such as EEG, EOG and EMG are shown in Fig.13 and have essentially the same design requirements as those for ECG measurement and impose the same performance demands on the recording amplifiers. Fig. 12 Modern Disposable, Adhesive, Pre-jelled ECG Electrodes 10 Fig. 13 Electrodes in Use in the Measurement of EEG, EOG and EMG 11


