a. monohybrid cross
advertisement
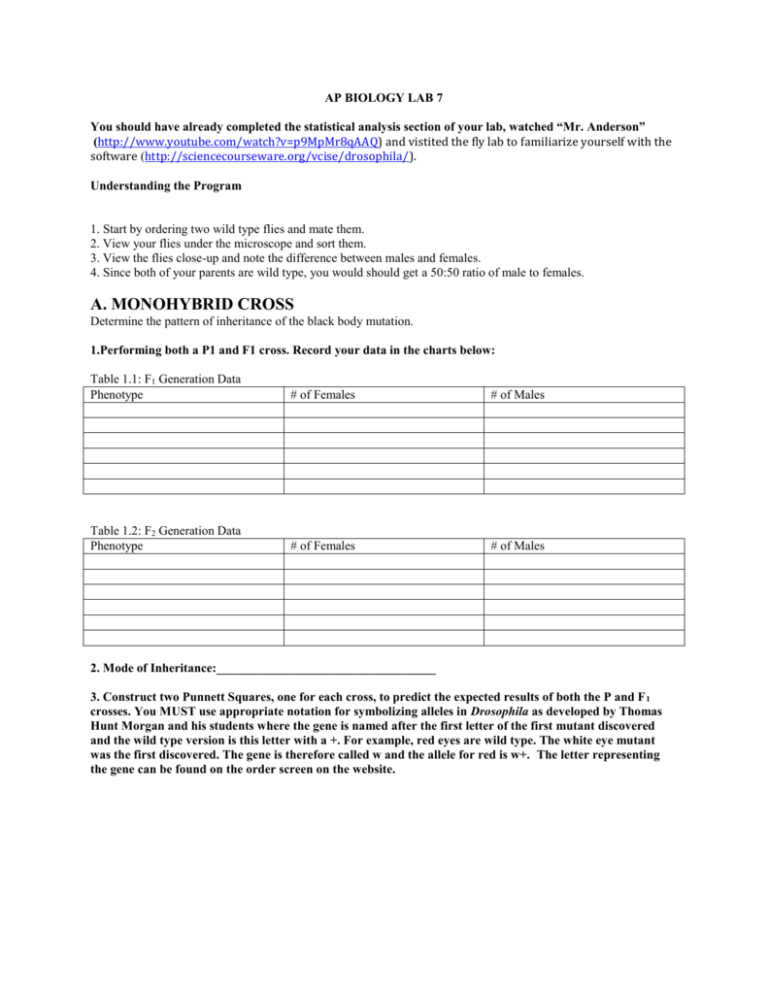
AP BIOLOGY LAB 7 You should have already completed the statistical analysis section of your lab, watched “Mr. Anderson” (http://www.youtube.com/watch?v=p9MpMr8qAAQ) and vistited the fly lab to familiarize yourself with the software (http://sciencecourseware.org/vcise/drosophila/). Understanding the Program 1. Start by ordering two wild type flies and mate them. 2. View your flies under the microscope and sort them. 3. View the flies close-up and note the difference between males and females. 4. Since both of your parents are wild type, you would should get a 50:50 ratio of male to females. A. MONOHYBRID CROSS Determine the pattern of inheritance of the black body mutation. 1.Performing both a P1 and F1 cross. Record your data in the charts below: Table 1.1: F1 Generation Data Phenotype # of Females # of Males Table 1.2: F2 Generation Data Phenotype # of Females # of Males 2. Mode of Inheritance:___________________________________ 3. Construct two Punnett Squares, one for each cross, to predict the expected results of both the P and F 1 crosses. You MUST use appropriate notation for symbolizing alleles in Drosophila as developed by Thomas Hunt Morgan and his students where the gene is named after the first letter of the first mutant discovered and the wild type version is this letter with a +. For example, red eyes are wild type. The white eye mutant was the first discovered. The gene is therefore called w and the allele for red is w+. The letter representing the gene can be found on the order screen on the website. 4. Are the deviations for the phenotypic ratio of the F 2 generation within the limits expected by chance? Statistically analyze the data using the Chi-square analysis. Refer to the critical values of the Chi-Square distribution table, which can be found online or on page 86 of your AP Bio Lab manual to determine the P (probability) value. Observed Phenotypes (o) Expected (e) (o-e) (o-e)2 (o-e)2/e Degrees of Freedom (df) =__________ Χ2=_________ P=__________ 5. Based on the P-value, can you accept or reject the null hypothesis (that there is likely no difference between observed and expected). Explain what the P-value tells you. B. SEX-LINKED TRAITS Perform crosses to identify a sex-linked allele. 1.Performing both a P1 and F1 cross. Record your data in the charts below: Table 1.1: F1 Generation Data Phenotype # of Females # of Males Table 1.2: F2 Generation Data Phenotype # of Females # of Males 2. Construct two Punnett Squares, one for each cross, to predict the expected results of both the P and F1 crosses: 3. Are the deviations for the phenotypic ratio of the F 2 generation within the limits expected by chance? Statistically analyze the data using the Chi-square analysis. Refer to the critical values of the Chi-Square distribution table, which can be found online or on page 86 of your AP Bio Lab manual to determine the P (probability) value. Observed Phenotypes (o) Expected (e) (o-e) (o-e)2 (o-e)2/e Degrees of Freedom (df) =__________ Χ2=_________ P=__________ 5. A reciprocal cross is a wild type male x mutant female followed by a mutant male x wild type female. (Obviously, you study the same trait here). Perform the reciprocal cross. Reciprocal cross you are performing:___________________________________ Table 1.1: F1 Generation Data for the reciprocal cross Phenotype # of Females # of Males 6. Construct a Punnett Square for the reciprocal cross to predict the expected results. 7. Are the deviations for the phenotypic ratio of the F 2 generation within the limits expected by chance? Statistically analyze the data using the Chi-square analysis. Refer to the critical values of the Chi-Square distribution table, which can be found online or on page 86 of your AP Bio Lab manual to determine the P (probability) value. Observed Phenotypes (o) Expected (e) (o-e) (o-e)2 (o-e)2/e Degrees of Freedom (df) =__________ Χ2=_________ P=__________ C. DIHYBRID CROSS 1. Select any two traits and perform crosses to identify two allele pairs that are of different chromosomes (independent assortment). 1.Perform both a P and F1 cross. Record your data in the charts below: Table 1.1: F1 Generation Data Phenotype # of Females # of Males Table 1.2: F2 Generation Data Phenotype # of Females # of Males 2. Construct two Punnett Squares, one for each cross, to predict the expected results of both the P and F 1 crosses: 3. Are the deviations for the phenotypic ratio of the F 2 generation within the limits expected by chance? Statistically analyze the data using the Chi-square analysis. Refer to the critical values of the Chi-Square distribution table, which can be found online or on page 86 of your AP Bio Lab manual to determine the P (probability) value. Observed Phenotypes (o) Expected (e) (o-e) (o-e)2 Degrees of Freedom (df) =__________ Χ2=_________ P=__________ D. Explain the inheritance pattern Explain the inheritance pattern of the CURLY WING allele (NOT CURVY, NOT CURVY!!) 1.Perform the appropriate P and F1 cross. Record your data in the charts below: Table 1.1: F1 Generation Data Phenotype # of Females # of Males (o-e)2/e Table 1.2: F2 Generation Data Phenotype # of Females # of Males 2. Construct two Punnett Squares, one for each cross, to predict the expected results of both the P and F 1 crosses: 3. Describe the inheritance pattern: 4. Are the deviations for the phenotypic ratio of the F 2 generation within the limits expected by chance? Statistically analyze the data using the Chi-square analysis. Refer to the critical values of the Chi-Square distribution table, which can be found online or on page 86 of your AP Bio Lab manual to determine the P (probability) value. Observed Phenotypes (o) Expected (e) Degrees of Freedom (df) =__________ Χ2=_________ P=__________ (o-e) (o-e)2 (o-e)2/e


