FLAME TEST AND ATOMIC SPECTRA LAB
advertisement
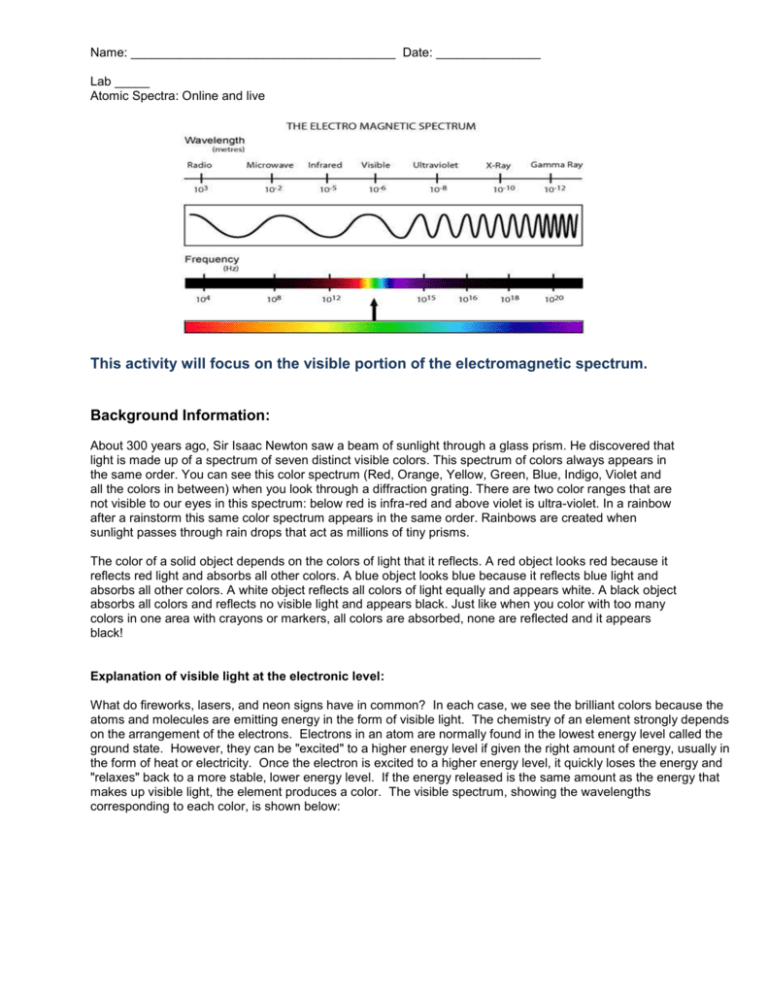
Name: ______________________________________ Date: _______________ Lab _____ Atomic Spectra: Online and live This activity will focus on the visible portion of the electromagnetic spectrum. Background Information: About 300 years ago, Sir Isaac Newton saw a beam of sunlight through a glass prism. He discovered that light is made up of a spectrum of seven distinct visible colors. This spectrum of colors always appears in the same order. You can see this color spectrum (Red, Orange, Yellow, Green, Blue, Indigo, Violet and all the colors in between) when you look through a diffraction grating. There are two color ranges that are not visible to our eyes in this spectrum: below red is infra-red and above violet is ultra-violet. In a rainbow after a rainstorm this same color spectrum appears in the same order. Rainbows are created when sunlight passes through rain drops that act as millions of tiny prisms. The color of a solid object depends on the colors of light that it reflects. A red object looks red because it reflects red light and absorbs all other colors. A blue object looks blue because it reflects blue light and absorbs all other colors. A white object reflects all colors of light equally and appears white. A black object absorbs all colors and reflects no visible light and appears black. Just like when you color with too many colors in one area with crayons or markers, all colors are absorbed, none are reflected and it appears black! Explanation of visible light at the electronic level: What do fireworks, lasers, and neon signs have in common? In each case, we see the brilliant colors because the atoms and molecules are emitting energy in the form of visible light. The chemistry of an element strongly depends on the arrangement of the electrons. Electrons in an atom are normally found in the lowest energy level called the ground state. However, they can be "excited" to a higher energy level if given the right amount of energy, usually in the form of heat or electricity. Once the electron is excited to a higher energy level, it quickly loses the energy and "relaxes" back to a more stable, lower energy level. If the energy released is the same amount as the energy that makes up visible light, the element produces a color. The visible spectrum, showing the wavelengths corresponding to each color, is shown below: Note: [1 Å = 0.1 nm] Is light a particle or a wave? Is light composed of waves or of particles? If light is waves, then one can always reduce the amount of light by making the waves weaker, while if light is particles, there is a minimum amount of light you can have - a single ``particle'' of light. In 1905, Einstein found the answer: Light is both! In some situations it behaves like waves, while in others it behaves like particles. This may seem odd. How can light act like both a wave and a particle at the same time? Consider a duckbilled platypus. It has some duck-like properties and some beaver-like properties, but it is neither. Similarly, light has some wavelike properties and some particle like properties, but it is neither a pure wave nor a pure particle. A wave of light has a wavelength, defined as the distance from one crest of the wave to the next, and written using the symbol . The wavelengths of visible light are quite small: between 400 mm and 650 nm, where 1 nm = 10-9 m is a ``nanometer'' - one billionth of a meter. Red light has long wavelengths, while blue light has short wavelengths. A particle of light, known as a photon, has an energy E. The energy of a single photon of visible light is tiny, barely enough to disturb one atom; we use units of “electron-volts”, abbreviated as eV, to measure the energy of photons. Photons of red light have low energies, while photons of blue light have high energies. The energy E of a photon is proportional to the wave frequency ѵ, E=hѵ where the constant of proportionality h is the Planck's Constant, h = 6.626 x 10⁻³⁴ J s. Also, the relationship between frequency and wavelength can be defined as: ѵ=c λ where c is the speed of light (3×10⁸ metres per second). So photons still have a wavelength. A famous result of quantum mechanics is that the wavelength relates to the energy of the photon. The longer the wavelength, the smaller the energy. For instance, ultraviolet photons have shorter wavelengths than visible photons, and thus more energy. This is why they can give you sunburn, while ordinary light cannot. Spectra can be simplified to one of three basic types. Simple examples in the visible wavebands are shown below: Type of Spectrum Photographic example Continuous (or continuum) Absorption (dark line) Emission (bright line) One means by which a continuous spectrum can be produced is by thermal emission from a black body. This is particularly relevant in astronomy. Astronomical spectra can be combination of absorption and emission lines on a continuous background spectrum. The important thing to know about absorption and emission lines is that every atom of a particular element will have the same pattern of lines all the time. And the spacing of the lines is the same in both absorption and emission, only emission lines are added to the continuum, while absorption lines are subtracted. In Part One, wooden splints dipped in solutions of metal salts are heated using a Bunsen burner, producing different colored flames. By comparing the color given off by an unknown with the known metal salts, the identity of the metal salt can be determined. In Part Two, electricity is passed through the gas discharge tube resulting in different colors. When the light is passed through a diffraction grating, it is broken into components, producing a line spectrum of the element. A comparison of the line spectrum with those of known gases will allow one to determine the identity of the unknown gas. Also, you will investigate the visible light emissions of “general” light sources. In Part Three, you will research various applications and/or natural occurrences of line spectra such as astronomy, aurora borealis, fireworks and neon lights. Part One: Flame Tests When solutions of metals are heated in a Bunsen burner flame, they give off characteristic colours. For example, sodium makes the flame turn bright yellow – this is the same yellow colour made by sodium street lamps and many fireworks. Materials: Bunsen burner Wooden splints (9 per group) Solutions (1.0 mol/L) of the following metal salts lithium chloride barium chloride strontium chloride calcium chloride copper(II)chloride sodium chloride potassium chloride sodium chloride/potassium chloride mixture an unknown metal chloride solution cobalt blue glass (if available) Procedure: 1. Obtain a cobalt blue glass and 9 wooden splints that have been soaking in the metal salt solutions (Why is soaking the splints important?). Be sure to label each wooden splint with the names of the salts so they are not mixed up. 2. Light the Bunsen burner and open the air vent to obtain a non-luminous flame with two blue cones. Be sure to avoid a yellow flame. (Why?) 3. Carefully place the end of the wooden splint that was soaked in the metal salt solution at the top of the inner blue cone. Record the color and intensity (bright/faint) of the flame in the data table. The color given off by the salt is the initial color observed, not the yellow-orange color produced by the burning wood. (To avoid burning the wood, wave the splint through the flame rather than holding it right in the flame). 4. Repeat with the other 8 salts. Be sure to record the colors as precisely as possible. 5. For the sodium potassium mixture, observe the colors as before and then again by looking through the cobalt glass. The cobalt glass cuts out any yellow-orange color. 6. If more observations are needed, dip the clean end of the wooden splint in the solutions for a few minutes and repeat. Otherwise, discard the wooden splints at the end of the experiment. Data Table: Use online source. Be descriptive with colors. Metal found in the salt Flame Color and Intensity Lithium Barium Strontium Calcium Copper Sodium Potassium Sodium and Potassium Without cobalt blue glass: With cobalt blue glass: Unknown Analysis: Type Answers in Calibri 10 pt. No Bold The electromagnetic spectrum is shown at the beginning of this document. Recall that energy is proportional to frequency, while frequency is inversely proportional to wavelength. Use this information to answer questions 1-4 below. 1. List the colors observed in this lab from the highest energy to the lowest energy. 2. List the colors observed in this lab from the highest frequency to the lowest frequency. 3. List the colors observed in this lab from the shortest wavelength to the longest wavelength. 4. What is the relationship between energy, frequency, and wavelength? 5. Based on the results of your experiment, what metal is found in the unknown? Explain. 6. What is the purpose of the cobalt blue glass? Why is only the purple color of the potassium seen through the cobalt glass? 7. Do you think we can use the flame test to determine the identity of unknowns in a mixture? Why or why not? 8. How are electrons “excited” in this part of the experiment? What does it mean the electrons are “excited”? 9. Explain why we did not see distinct lines when the metal salts were burned. 10. What particles are found in the chemicals that may be responsible for the production of colored light? 11. Why do different chemicals emit different colors of light? 12. Why do you think the chemicals have to be heated in the flame first before the colored light is emitted? 13. Colorful light emissions are applicable to everyday life. Where else have you observed colorful light emissions? Are these light emission applications related? Explain. Part Two: Atomic Spectra During this experiment you will make use of a device known as a diffraction grating spectrometer. A diffraction grating splits a single beam of light into the many colors which it contains. The colors should be ordered like a rainbow, from blue on one side to red on the other. The brightness of the image in each color shows you how much light the object is emitting of that color. We will be using these diffraction gratings to look at "spectral tubes". These are tubes which contain gases composed of different elements. By plugging these tubes into the wall, we can send electricity through them, which adds energy to the gas. This causes the atoms to become "excited", which is how we describe atoms whose electrons have been raised into high energy levels. After a short amount of time the electrons drop back into lower energy states, releasing a photon to carry off the extra energy. Depending on the number of transitions in each atom and the energy levels in it, photons of different wavelengths and thus different colors are released from each gas. Each element has its own unique line spectrum and is thus referred to as the “fingerprint” for a particular element. The spectra for each element are unique because each element contains differing numbers of electrons and thus different energy levels. Think about the following questions as you look at the spectral lines corresponding to each gas: Are the lines closely packed, or spread out over many different colors? Are there many lines you can see, or only a few? How do the colors of the lines from each tube relate to the color you see from each tube when you don't look through the gratings? You will also be observing other light sources to see how their spectra compare to that of the gas tubes. Materials: gas discharge tube gas filled tubes (hydrogen, helium, neon, argon, mercury, and an unknown) spectroscope/diffraction grating tube (or glasses) incandescent light (40W light bulb) fluorescent light bug light Procedure: 1. Go to one of the lab stations where a hydrogen gas discharge tube is set up. 2. Turn on the electricity (for no more than 30 seconds) and observe the color given off by the gas. Record your observations in the data table below. If more time for observation is needed, turn off the tube for ~15 seconds and then turn on for another 30 seconds. Do not leave the tube continuously turned on; otherwise, it will burn out the tube. 3. Hold the spectrometer so the diffraction slit is towards the light source and the diffraction grating (window) is towards you. (See diagram below). Diffraction slit Diffraction grating 4. Look through the diffraction grating and observe and record the colored lines (spectrum) produced by hydrogen gas. Record only one set of colors. Complete the data table below and then draw the color lines in the spectrum boxes that follow. *Note: these visible spectral lines represent electron transitions from energy levels 3, 4, 5 and 6 to energy level 2. For the hydrogen atom, when the electron falls from the third energy level down to the second energy level a red color is emitted. This should make sense as it is falling the shortest distance which corresponds to the lowest frequency of visible light, which is red. All other colors observed in the spectrum of hydrogen are a result of electron transitions from other energy levels (4, 5 and 6) to energy level 2. 5. Go to the rest of the lab stations and repeat for each element (helium, neon, argon, mercury) and the unknown. Data Table: Line spectra of elements: Copy and Paste from online Color of the discharge tube Hydrogen Helium Neon Argon Mercury Unknown Number of different colored lines in the spectrum Draw a detailed view of the spectra (including approximate wavelengths) observed below: Hydrogen: Helium: Neon: Argon: Mercury: Unknown: 6. Now investigate a series of general light sources such as indirect sunlight (Never look directly at the sun!), shade, fluorescent lights, a light bulb, etc. and record what is observed in the second data table below. 7. Draw a detailed view of all spectra observed in the spectrum boxes on the next page. Data Table: Spectra of other light sources: Copy and Paste from online Color of the discharge tube 40W Light bulb (incandescent) Indirect sunlight Partial shade Fluorescent light Bug light Incandescent (40 W light bulb): Indirect Sunlight: Partial Shade: Fluorescent Light: Bug Light: Line or continuous Spectra (or both)? Analysis: Type Answers in Calibri 10 pt. No Bold 1. What is the difference between a line spectrum and a continuous spectrum? Provide an example of each. 2. Which light source produced both a continuous and a line spectrum? 3. Each line in the emission spectrum of the hydrogen corresponds to an electromagnetic radiation with a specific wavelength. Match the 4 observed colors with the following wavelengths: 410 nm, 434 nm, 486 nm, and 656 nm. 4. How are electrons “excited” in this part of the lab? What happens when the electrons relax? 5. What do the different colors in a line spectrum represent? Why are the spectra for each element unique? 6. It has been calculated that the observed colors in a hydrogen atom correspond to the relaxation of the electron from a higher energy level to the second energy level. Which color corresponds to 62 transition? 5 2 transition? 42 transition? 32 transition? Explain your reasoning. 7. Which element produced the largest number of lines? Which element produced the smallest number of lines? Explain why elements produce different numbers of spectral lines. 8. What gas do you think is found in the unknown? Explain your reasoning. 9. Do you notice a similarity in the line spectrum of Mercury and the spectrum observed with the fluorescent bulb? Explain why this might be. 10. Each element has its own unique line emission spectrum, just like fingerprints. Explain how this technique can be used to determine the elemental composition of stars. 11. How close were your wavelength measurements to the accepted values of wavelengths for the various gases as listed below? What factors do you think might have contributed to any differences, and how might they have affected your measurements? The accepted values and spectra are shown below: (or compare with a spectral chart displayed in your classroom) Hydrogen: a simple atom with a simple spectrum. Besides the three lines shown here, you may be able to see another in the blue near 410 nm. Helium: slightly more complex than hydrogen, with one yellow line and a number in the blue. Neon: a very large number of lines in the red give neon signs their distinctive pink colors, but notice the two green lines. Argon: the pastel color of argon is due to a wide range of lines throughout the spectrum. Mercury: the strongest line, at 546 nm, gives mercury a greenish color. The following links may be of interest (particularly for Part Two): Glowing Pickle Demo: http://www.exo.net/~pauld/activities/aaptelectric/glowingpickle.html An excellent site that shows the emission or absorption spectrum of all elements on the periodic table: http://jersey.uoregon.edu/vlab/elements/Elements.html Emission Spectroscopy of Elements - Simulation: http://phys.educ.ksu.edu/vqm/html/emission.html Absorption Spectroscopy of Elements - Simulation: http://phys.educ.ksu.edu/vqm/html/absorption.html Rainbow symphony store: (sells diffraction grating glasses, spectrum tubes etc.) http://www.rainbowsymphonystore.com/scienanded1.html Hydrogen Energy Level Applet: http://www.bpreid.com/applets/hel.html


