Public opinion among Aiken County voters
advertisement
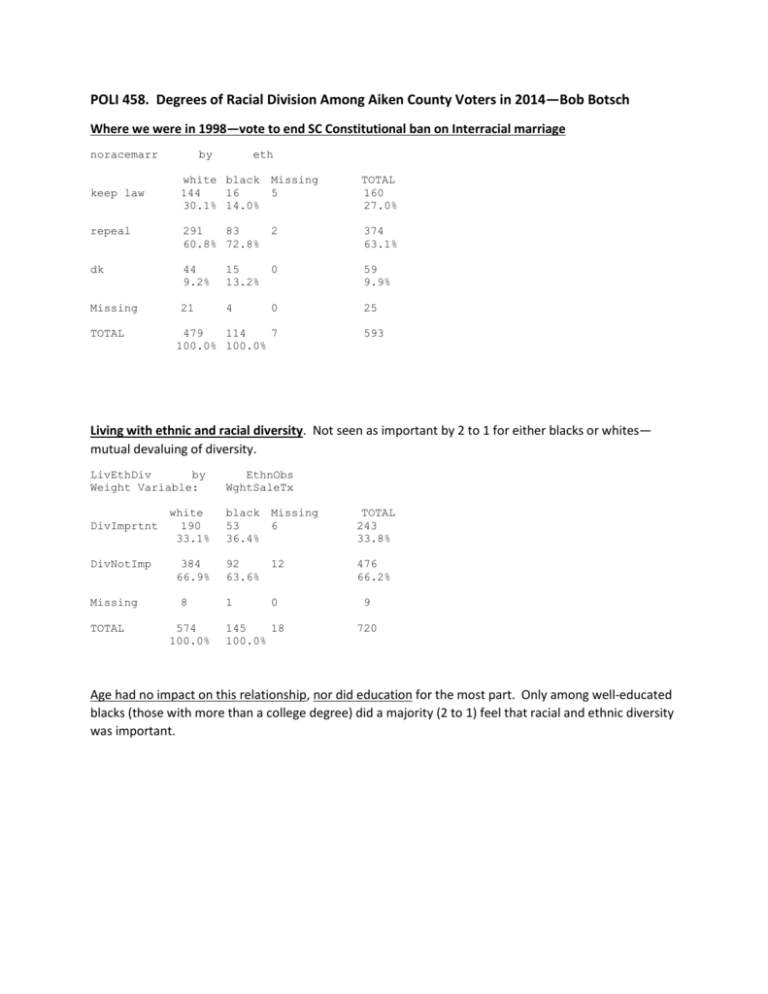
POLI 458. Degrees of Racial Division Among Aiken County Voters in 2014—Bob Botsch Where we were in 1998—vote to end SC Constitutional ban on Interracial marriage noracemarr by eth white black 144 16 30.1% 14.0% Missing 5 TOTAL 160 27.0% repeal 291 83 60.8% 72.8% 2 374 63.1% dk 44 9.2% 15 13.2% 0 59 9.9% Missing 21 4 0 25 keep law TOTAL 479 114 7 100.0% 100.0% 593 Living with ethnic and racial diversity. Not seen as important by 2 to 1 for either blacks or whites— mutual devaluing of diversity. LivEthDiv by Weight Variable: DivImprtnt DivNotImp Missing TOTAL EthnObs WghtSaleTx white 190 33.1% black 53 36.4% Missing 6 TOTAL 243 33.8% 384 66.9% 92 63.6% 12 476 66.2% 1 0 8 574 100.0% 145 18 100.0% 9 720 Age had no impact on this relationship, nor did education for the most part. Only among well-educated blacks (those with more than a college degree) did a majority (2 to 1) feel that racial and ethnic diversity was important. Perceptions of political power of blacks. While virtually no blacks felt that blacks had too much political power, a little over a third of all whites felt that way. BlackPwr by Weight Variable: EthnObs WghtSaleTx white black 311 113 62.8% 97.4% Missing 14 TOTAL 425 69.4% yes 185 3 37.2% 2.6% 2 188 30.6% Missing 86 2 117 TOTAL 496 116 17 100.0% 100.0% no 30 612 Moving the Confederate Battle Flag. Opposing majorities of more than two-thirds on opposite sides. ConfedFlag by Weight Variable: EthnObs WghtSaleTx white black 111 92 19.6% 69.6% Missing 6 Mixed feel 105 22 18.6% 16.8% 1 127 18.2% keep there 349 18 61.8% 13.6% 9 367 52.7% Missing 17 2 32 remove TOTAL 15 565 132 16 100.0% 100.0% TOTAL 202 29.1% 696 Expanding Medicaid in SC. Opposing majorities among those who have opinions. SCExpMedcd by Weight Variable: EthnObs WghtSaleTx white 231 54.3% black 17 14.9% Missing 7 TOTAL 248 46.0% favor 194 45.7% 96 85.1% 6 290 54.0% Missing 157 34 5 190 TOTAL 425 100.0% 113 13 100.0% oppose 538 Keeping provisions in the ACA. Opposing strong majorities. ACAKeepAll by Weight Variable: EthnObs WghtSaleTx white black 362 47 72.1% 37.6% Missing 10 TOTAL 408 65.3% KeepAll 140 77 27.9% 62.4% 6 217 34.7% Missing 81 2 103 NotKeepAll TOTAL 23 501 124 16 100.0% 100.0% 625 Work Ethic. By 2 to 1, whites are more likely than blacks to feel that people are more likely to want a government handout than wanting to work. SCExpMedcd by Weight Variable: EthnObs WghtSaleTx white black Missing TOTAL oppose 231 17 54.3% 14.9% 7 248 46.0% favor 194 96 45.7% 85.1% 6 290 54.0% Missing 157 5 190 TOTAL 425 113 13 100.0% 100.0% 34 538 Obama a Muslim. Only a third of whites know the factually correct answer. Muslim by Weight Variable: EthnObs WghtSaleTx white black Missing TOTAL yes 236 8 43.8% 6.3% 4 244 36.7% no 175 98 32.4% 77.7% 8 273 41.0% NotSure 128 20 23.8% 16.0% 6 148 22.3% Missing 43 0 63 TOTAL 20 539 126 18 100.0% 100.0% 665 Corporate Power. While majorities of both groups see corporations as having too much power, blacks are twice as likely to feel this way. CorpPwr by Weight Variable: EthnObs WghtSaleTx white black 200 22 39.0% 18.5% Missing 5 TOTAL 222 35.1% yes 313 97 61.0% 81.5% 12 410 64.9% Missing 69 1 96 TOTAL 513 119 17 100.0% 100.0% no 27 632 Partisanship among voters. Overwhelming opposing majorities—more white independents than white Democrats. PtyID3 by Weight Variable: EthnObs WghtSaleTx white black 76 122 13.4% 88.9% Missing 6 TOTAL 198 28.2% indep 109 8 19.2% 6.1% 2 117 16.6% Rep 382 7 67.4% 5.1% 10 389 55.2% Missing 16 0 TOTAL 566 138 18 100.0% 100.0% Dem 9 25 703 And age makes NO difference: 14% of the 18-35 whites are Dem and 13% of the 66+ whites are Dem! Regional id does make a difference: 33% of non-southern whites are Dem (almost identical to the % who are Rep—36%), and only 11% of native southerners are Dem. Education also made a difference: only 6% of those whites with a hs degree or less were Dem, compared to 26% of those whites with more than a college degree. Economic class—family income. Great differences here in that blacks are 2x more likely than whites to be in the lowest family income group and whites are almost 4x more likely than blacks to be in the highest income group. If we pull out the highest income group (>$100k), the difference is even more stark: almost 1 in 4 whites make it into this group compared to only 1 in 20 black families. FamIncome3 by Weight Variable: EthnObs WghtSaleTx white black 147 75 29.5% 61.7% Missing 4 TOTAL 222 35.8% $40-75k 154 32 31.0% 26.7% 7 187 30.1% >$75 197 14 39.5% 11.6% 6 211 34.0% Missing 83 1 109 <$40k TOTAL 25 499 121 17 100.0% 100.0% 620 Religion and same-sex marriage. Blacks are somewhat more likely than whites to consider themselves as religious fundamentalists (41% compared to 28%). Yet blacks are slightly less likely than whites to say they oppose same-sex marriage (49% and 55% respectively). Changes in White Views about Blacks, 2008-2014. Are we moving backwards? Has the election of an African-American president triggered latent white prejudice and their worst fears? Whites voters only Blacks too much power Keep Confed Flag flying Obama is really Muslim 2008 2010 2012 2014 change 17% -- 34% 37% + 20 % pts 58% -- 51% 60% + 2 % pts 22% 35% 40% 44% + 22 % pts
