Statistics (CP) Syllabus
Paige Rios
St Helena High School
Statistics (CP) 2014-2015
Email
prios@sthelenaunified.org
LMS
www.myhaikuclass.com/paige.rios/cpstatistics
Twitter
@shhsrios
Website
https://sites.google.com/site/riosshhs/
Brief Description of Course:
This course will emphasize statistics as a practical discipline. The material will require students
to discuss the problem and justify the method (think), to do some work by hand or technology
(show), and to draw a reasoned conclusion that responds to the initial motivation for the exercise
(tell). The course will examine data analysis through statistical graphs, standard deviation,
sampling variability, inference, data re-expression, sample surveys and experiments, and
probability distributions. Students using data from issues that students are likely to encounter in
everyday life from games of chance, politics, business, social sciences, science, and sports. The
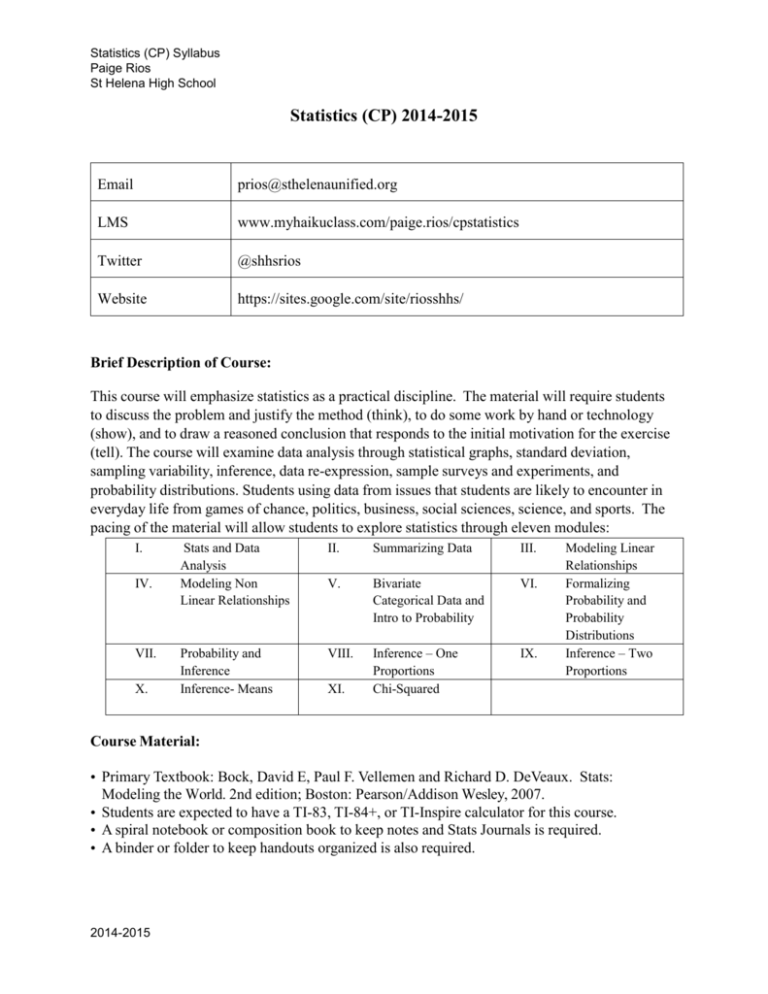
pacing of the material will allow students to explore statistics through eleven modules:
I.
IV.
VII.
X.
Stats and Data
Analysis
Modeling Non
Linear Relationships
II.
Summarizing Data
III.
V.
Bivariate
Categorical Data and
Intro to Probability
VI.
Probability and
Inference
Inference- Means
VIII.
Inference – One
Proportions
Chi-Squared
IX.
XI.
Modeling Linear
Relationships
Formalizing
Probability and
Probability
Distributions
Inference – Two
Proportions
Course Material:
• Primary Textbook: Bock, David E, Paul F. Vellemen and Richard D. DeVeaux. Stats:
Modeling the World. 2nd edition; Boston: Pearson/Addison Wesley, 2007.
• Students are expected to have a TI-83, TI-84+, or TI-Inspire calculator for this course.
• A spiral notebook or composition book to keep notes and Stats Journals is required.
• A binder or folder to keep handouts organized is also required.
2014-2015
Statistics (CP) Syllabus
Paige Rios
St Helena High School
Grading:
Quizzes/Exams
50%
Problem Sets/Stats
Journals/Homework
35%
In-class Activities
15%
This is a college-preparatory math class different from any other completed in the past.
Statisticians work on displaying and describing data so that data analysis may take place. In
today’s world, we are collecting data at an unprecedented rate from the fields of commerce,
medicine, sports, and education, just to name a few. The analysis of this data leads to decision
making which impacts everything we do. Therefore, mathematical computation is only one
piece of the puzzle in statistical analysis.
Showing data in displays and written explanations of
results are also used to complete analysis. This course will follow a Think-Show-Tell as we work
with data. Investigative activities aid in learning the material. Students are expected to be active
participants in the learning process everyday.
Course Expectations
All work assigned acts as an assessment of conceptual understanding. Given that, each
assignment will be scored for accuracy not simply completion.
Reading/Videos
Students are
expected to read
the corresponding
textbook
assignment and
take notes. In
addition, videos
posted on the
LMS to provide
additional
examination of
each chapter’s
topics.
2014-2015
Problem Sets
Stats Journals
Each module will
have corresponding
problem set(s)
assigned. Due
dates will be listed
on the problem
sets. Students are
encouraged to work
on these each night
and use them as a
tool to guide study
groups. Due dates
for problem sets
are firm. If you are
absent, it is
expected that you
get your problem
set turned in.
Spiral notebooks or
composition books
will be used to keep
notes and
responses to “Stats
Journal” prompts.
The Stats Journals
will be graded
approximately once
per month.
Students will be
responsible to keep
their journals
updated and
complete. The LMS
will be maintained
for student’s to
reference prompts.
Quizzes and
Exams
Each module will
have at least one
quiz to assess
your
understanding of
the concepts
presented in the
module. In
addition, there will
be a midterm (Oct
2, 2014 and
March 12, 2015)
and a final at the
end of each
semester. These
exams will be
cumulative
exams.
Statistics (CP) Syllabus
Paige Rios
St Helena High School
2014-2015
Statistics (CP) Syllabus
Paige Rios
St Helena High School
Pacing
Module Title (end
date)
I. Stats and Data
Analysis
(Sept 18)
Lessons
Lesson 1.1.1: The Statistical Analysis Process
Lesson 1.1.2: Types of Statistical Studies and
Scope of Conclusions
Lesson 1.2.1: Collecting Data by Sampling
Lesson1.2.2:RandomSampling
Lesson 1.2.3: Other Sampling
Strategies
Lesson 1.2.4: Sources of Bias in Sampling
Lesson 1.3.1: Collecting Data by Conducting an Experiment
Lesson 1.3.2: Other Design Considerations—Blinding, Control
Groups, and Placebos
Lesson 1.4.1: Drawing Conclusions from Statistical Studies
II. Summarizing
Data Graphically
and Numerically
(Oct 13)
Lesson 2.1.1: Dotplots, Histograms, and Distributions
for Quantitative Data
Lesson 2.1.2: Constructing Histograms for
MIDTERM ON
October 2, 2014
Quantitative Data
Lesson 2.1.3: Comparing Distributions of Quantitative Data in Two
END OF FIRST
QUARTER
October 10, 2014
Independent Samples
Lesson 2.2.1: Quantifying the Center of a Distribution—Sample Mean
and Sample Median
Lesson 2.2.2: Constructing Histograms for Quantitative Data
Lesson 2.3.1: Quantifying Variability
Relative to the Median
Lesson 2.4.1: Quantifying Variability
Relative to the Mean
Lesson 2.4.2: The Sample Variance
2014-2015
Statistics (CP) Syllabus
Paige Rios
St Helena High School
III. Modeling Linear
Relationships
(November 13)
Lesson 3.1.1: Intro to Scatterplots and Bivariate
Relationships
Lesson 3.1.2: Form, Direction and Strength
Lesson 3.1.3: Correlation Coefficient
Lesson 3.1.4: Correlation Formula
Lesson 3.1.5: Correlation is NOT Causation
Lesson 3.2.1: Making Predictions with Lines
Lesson 3.2.2: LSRL as a Line of Best Fit
Lesson 3.2.3: Meaning of Numbers in LSRL
Lesson 3.2.4: Special Properies of LSRL
Lesson 3.3.1: Using Residuals to measure Good Fit
Lesson 3.3.2: Using Residuals to Determine is a Line
is a Good Model
IV. Modeling
NonLinear
Relationships
Lesson 4.1.1: Investigating Patterns in Data
Lesson 4.1.2: Exponential Models
Lesson 4.1.3: Assessing How Well a Model Fits the
Data
V. Bivariate
Categorical Data
and Intro to
Probability
(December 12)
Lesson 5.1.1: Reasoning about Risk and Chance
Lesson 5.1.2: Defining Risk
Lesson 5.1.3: Interpreting Risk
Lesson 5.1.4: Comparing Risk
Lesson 5.1.5: More on Conditional Risks
Final Exam (Third
Week in December)
VI. Formalizing
Probability and
Probability
Distributions
(January 29)
2014-2015
Modules 1-5
Lesson 6.1.1: Probability
Lesson 6.1.2: Probability Rules
Lesson 6.1.3: Simulation, Discrete Random Variables,
Statistics (CP) Syllabus
Paige Rios
St Helena High School
and Probability Distributions
Lesson 6.2.1: Probability Distributions of Continuous
Random Variables
Lesson 6.2.2: Z-Scores and Normal Distributions
Lesson 6.2.3: Using Normal Distributions to Find
Probabilities and Critical Values
VII. Linking
Probability to
Inference
(February 20)
Lesson 7.1.1: Statistics and Sampling Variability
Lesson 7.1.2: Sampling from a Population
Lesson 7.1.3: Testing Statistical Hypotheses
Lesson 7.2.1: Two Types of Inferential Procedures
Lesson 7.2.2: Distributions and Confidence Intervals
Lesson 7.2.3: Distributions and Hypothesis Testing
VIII. Inference for
One Proportion
(March 12)
MIDTERM
March 12
END OF THIRD
QUARTER
March 17
IX. Inference for
Two Proportions
(April 3)
Lessons 8.1.1-8.1.2: Sampling Distribution of One
Proportion
Lessons 8.2.1- 8.3.1: Estimation of One Proportion
Lesson 8.3.2: Hypothesis Testing for One Proportion
Lesson 9.1.1: Sampling Distribution of Difference in
Two Proportions
Lesson 9.1.2.: Exploring Sampling Distribution of
Difference in Two Proportions
Lesson 9.2.1: Confidence Intervals for Difference in
Two Population Proportions
Lesson 9.2.2: Computing and Interpreting CI for
Difference in Two Proportions
Lessons 9.3.1-9.3.3: Statistical Tests for the Difference
in Two Proportions
2014-2015
Statistics (CP) Syllabus
Paige Rios
St Helena High School
X. Inference for
Means
(May 11)
Lessons 10.1.1-10.1.2: The Sampling Distribution of
the Sample Mean
Lesson 10.2.1: Estimating a Population Mean
Lesson 10.2.2: T-Statistics and T-Distributions
Lesson 10.2.3: CI for a Population Mean
Lesson 10.3.1: Testing Hypotheses about a Population
Mean
Lesson 10.3.2: P-Values, One Sample T-Test
Lesson 10.4.1: Inference about the Difference Between
Two Population Means
Lesson 10.4.2: Inference for Paired Data
Lesson 10.4.3: Two-Sample T-Test
XI. Chi-Squared
Tests
(May 29)
Lessons 11.1.1-11.1.3: Chi-Square Tests for One Way
Tables
Lessons 11.2.1-11.2.3: Chi-Square Tests for Two-Way
Tables
Final Exam
First Week in June
2014-2015
Modules 6-11
Statistics (CP) Syllabus
Paige Rios
St Helena High School
2014-2015
Statistics (CP) Syllabus
Paige Rios
St Helena High School
Unit/
Chapter
III/11
Understanding
Randomness
Objectives
-randomness and simulation
design
III/12 Sample
Surveys
-terminology of sampling
-population parameters
-bias in sampling
III/13
Experiments
and
Observational
Studies
-identifying elements of
observational studies
-principles of experimental design
-effects of confounding and
lurking variables on experiments
and obs studies.
Midterm
Gathering Data
IV/14
Probability
-random phenomena
-Law of Large Numbers
-disjoint vs independent
-Addition, Multiplication and
Complement rules
IV/15
Probability
Rules
-General Addition and
Multiplication Rules
-conditional probability
-independence
-tree diagrams
IV/16
Random
Variables
-creating probability models
-expected values
-combining means and variances
IV/17
Probability
Models
-Bernoulli trials
-geometric and binomial models
-success/failure condition
Midterm
Randomness and Probability
V/18
Sampling
Distribution
Models
-Central Limit Theorem
-mean and std dev of sample
distributions
-standard error
V/19
Confidence
Intervals for
Proportions
-construction of one-proportion zintervals
-margin of error
-interpretation of one-proportion
z-interval
2014-2015
Activities
Exam
Exam
Due Dates
Statistics (CP) Syllabus
Paige Rios
St Helena High School
Unit/
Chapter
Objectives
V/20 Testing
Hypotheses
for
Proportions
-null and alternative hypotheses
-conditions for z-test
-perform a one-proportion z-test
-interpret results of oneproportion z-test
V/21 More
About Tests
-connecting hypothesis tests and
confidence intervals
-P-values and statistical
significance
-alpha levels and critical values
-Type I and II errors
-power and effect
V/22
Comparing
Two
Proportions
-hypotheses for testing difference
of two proportions
-confidence intervals and z-tests
for the difference in two
proportions
-conditions for testing
Midterm
From Data at Hand to the World
at Large
VI/23
Inference
About Means
-assumptions for t-tests and
intervals
-compute and interpret t-tests and
t-intervals
VI/24
Comparing
Means
-conditions and assumptions for
two-sample t-test and two-sample
t-interval
-perform and interpret two-sample
t-tests and intervals
-degrees of freedom
VI/25 Paired
Samples and
Blocks
-recognize whether two groups
are paired or not
-perform paired t-tests and create
paired confidence intervals
-interpret results of paired tests
VI/26
Comparing
Counts (ChiSquare)
-Chi-square tests of goodness of
fit, independence and
homogeneity.
-check conditions, perform and
interpret above tests
Final Exam
2014-2015
Activities
Due Dates
Exam
June 2014


