AP Statistics - Boone County Schools
advertisement
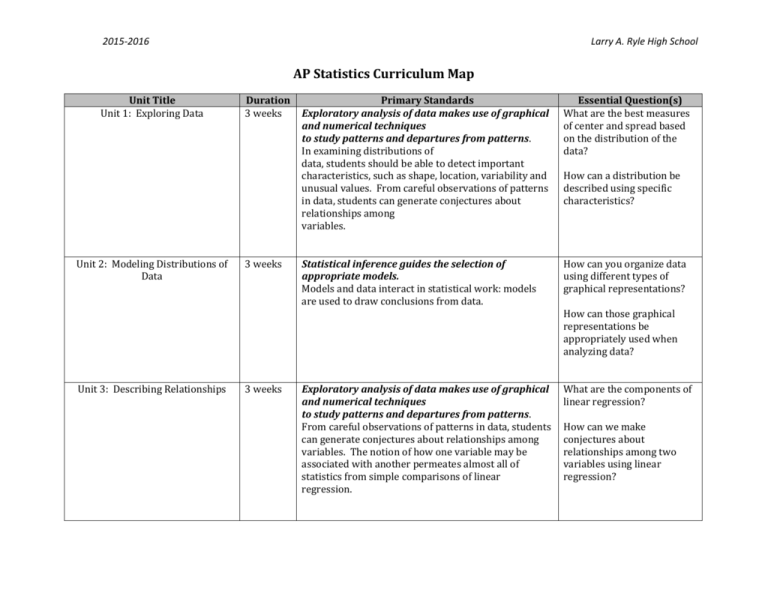
2015-2016 Larry A. Ryle High School AP Statistics Curriculum Map Unit Title Unit 1: Exploring Data Unit 2: Modeling Distributions of Data Duration 3 weeks 3 weeks Primary Standards Exploratory analysis of data makes use of graphical and numerical techniques to study patterns and departures from patterns. In examining distributions of data, students should be able to detect important characteristics, such as shape, location, variability and unusual values. From careful observations of patterns in data, students can generate conjectures about relationships among variables. Essential Question(s) What are the best measures of center and spread based on the distribution of the data? Statistical inference guides the selection of appropriate models. Models and data interact in statistical work: models are used to draw conclusions from data. How can you organize data using different types of graphical representations? How can a distribution be described using specific characteristics? How can those graphical representations be appropriately used when analyzing data? Unit 3: Describing Relationships 3 weeks Exploratory analysis of data makes use of graphical and numerical techniques to study patterns and departures from patterns. From careful observations of patterns in data, students can generate conjectures about relationships among variables. The notion of how one variable may be associated with another permeates almost all of statistics from simple comparisons of linear regression. What are the components of linear regression? How can we make conjectures about relationships among two variables using linear regression? 2015-2016 Unit 4: Designing Studies Unit 5: Probability Larry A. Ryle High School 3 weeks 3 weeks Data must be collected according to a welldeveloped plan if valid information is to be obtained. If data are to be collected to provide an answer to a question of interest, a careful plan must be developed. Collecting data in a reasonable way, through either sampling or experimentation, is an essential step in the data analysis process. What are methods of collecting data and how can we use these designed studies to analyze data? Exploratory analysis of data makes use of graphical and numerical techniques to study patterns and departures from patterns. The difference between association and causation must accompany this conceptual development throughout. What is the difference between association and causation? Probability is the tool used for anticipating what the distribution of data should look like under a given model. Interpreting probability, including long-run relative frequency interpretation, “Law of Large Numbers” concept, the addition rule, multiplication rule, conditional probability and Independence (notion of independence versus dependence). What is implied with the theory of “Law of Large Numbers”? How does a conditional event affect the probability of an outcome? What is the difference between independent and dependent probability? 2015-2016 Unit 6: Random Variables Unit 7: Sampling Distributions Unit 8: Estimation Larry A. Ryle High School 2 weeks 3 weeks 3 weeks Probability is the tool used for anticipating what the distribution of data should look like under a given model. Discrete random variables and their probability distributions, including binomial and geometric What are the characteristics of a binomial distribution and how can the probability distribution be calculated? Probability is the tool used for anticipating what the distribution of data should look like under a given model. The normal distribution Properties of the normal distribution Using tables of the normal distribution The normal distribution as a model for measurements Sampling distributions Sampling distribution of a sample proportion Sampling distribution of a sample mean Central Limit Theorem t-distribution What is a sampling distribution? Statistical inference guides the selection of appropriate models. Models and data interact in statistical work: models are used to draw conclusions from data, while the data are allowed to criticize and even falsify the model through inferential and diagnostic methods. Inference from data can be thought of as the process of selecting a reasonable model, including a statement in probability language, of how confident one can be about the selection. How do we estimate a population proportion? What are the characteristics of a geometric distribution and how can the probability distribution be calculated? Based on knowledge about a sampling distribution, how can we calculate the probability of sampling distributions for proportions and means? How do we estimate a population mean? 2015-2016 Unit 9: Hypothesis Testing Unit 10: Inferences about Differences Larry A. Ryle High School 3 weeks 2 weeks Statistical inference guides the selection of appropriate models. Logic of significance testing, null and alternative hypotheses; p-values; one- and two-sided tests; concepts of Type I and Type II errors; concept of power. Large sample test for a proportion. Test for a mean. How can hypothesis testing help us make informed statistical decisions? Probability is the tool used for anticipating what the distribution of data should look like under a given model. Sampling distribution of a difference between two independent sample proportions Sampling distribution of a difference between two independent sample means Simulation of sampling distributions What inferences can be made about two proportion distributions? How do confidence interval and hypothesis test conclusions relate to one another? What inferences can be made about two mean distributions? Unit 11: Inferences for Categorical Data (Chi-Square) 1 week Statistical inference guides the selection of appropriate models. Chi-square test for goodness of fit, homogeneity of proportions, and independence (one- and two-way tables) How can inferences be made about categorical data? Unit 12: More about Regression 1 week Statistical inference guides the selection of appropriate models. Test for the slope of a least-squares regression line. What inference can be made about the slope of a linear regression line? AP Preparation 3 weeks Review of all standards included in the College Board’s AP Statistics course description.


