Discovering Plate Boundaries Activity
advertisement
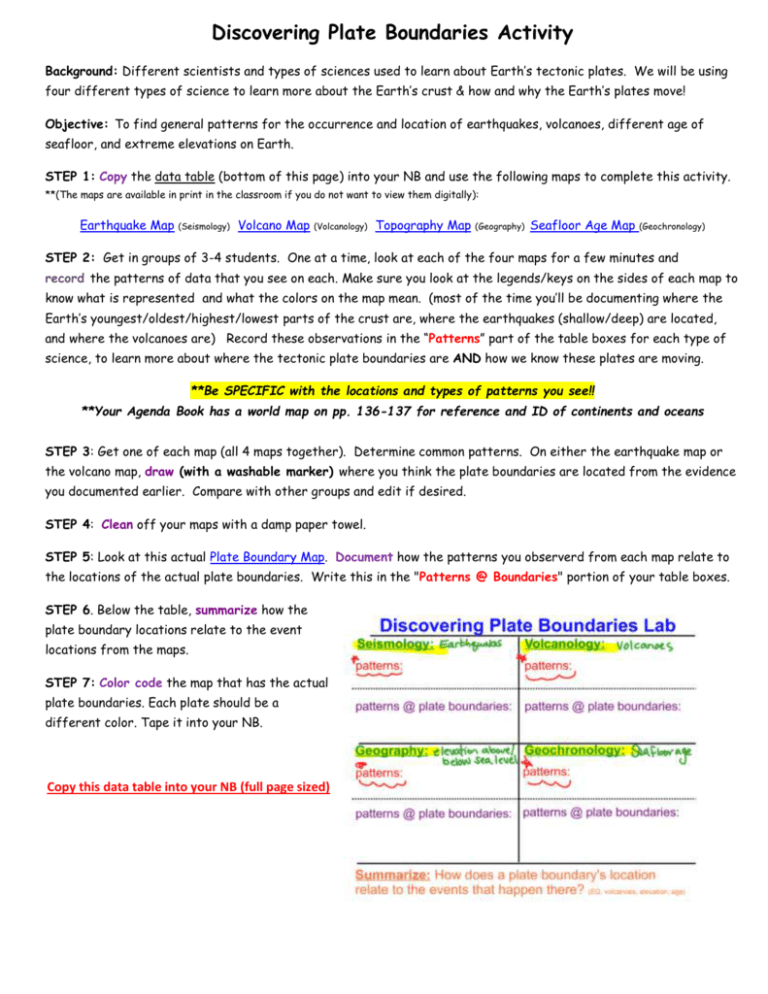
Discovering Plate Boundaries Activity Background: Different scientists and types of sciences used to learn about Earth’s tectonic plates. We will be using four different types of science to learn more about the Earth’s crust & how and why the Earth’s plates move! Objective: To find general patterns for the occurrence and location of earthquakes, volcanoes, different age of seafloor, and extreme elevations on Earth. STEP 1: Copy the data table (bottom of this page) into your NB and use the following maps to complete this activity. **(The maps are available in print in the classroom if you do not want to view them digitally): Earthquake Map (Seismology) Volcano Map (Volcanology) Topography Map (Geography) Seafloor Age Map (Geochronology) STEP 2: Get in groups of 3-4 students. One at a time, look at each of the four maps for a few minutes and record the patterns of data that you see on each. Make sure you look at the legends/keys on the sides of each map to know what is represented and what the colors on the map mean. (most of the time you’ll be documenting where the Earth’s youngest/oldest/highest/lowest parts of the crust are, where the earthquakes (shallow/deep) are located, and where the volcanoes are) Record these observations in the “Patterns” part of the table boxes for each type of science, to learn more about where the tectonic plate boundaries are AND how we know these plates are moving. **Be SPECIFIC with the locations and types of patterns you see!! **Your Agenda Book has a world map on pp. 136-137 for reference and ID of continents and oceans STEP 3: Get one of each map (all 4 maps together). Determine common patterns. On either the earthquake map or the volcano map, draw (with a washable marker) where you think the plate boundaries are located from the evidence you documented earlier. Compare with other groups and edit if desired. STEP 4: Clean off your maps with a damp paper towel. STEP 5: Look at this actual Plate Boundary Map. Document how the patterns you observerd from each map relate to the locations of the actual plate boundaries. Write this in the "Patterns @ Boundaries" portion of your table boxes. STEP 6. Below the table, summarize how the plate boundary locations relate to the event locations from the maps. STEP 7: Color code the map that has the actual plate boundaries. Each plate should be a different color. Tape it into your NB. Copy this data table into your NB (full page sized)
