Ch. 2 Review Practice
advertisement
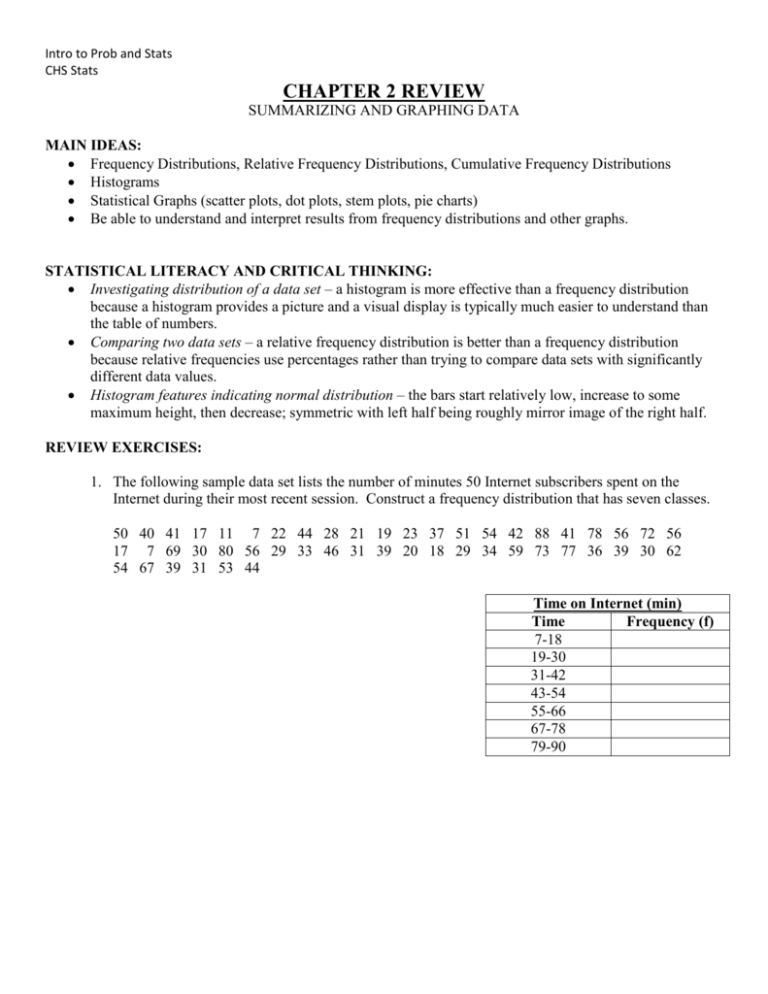
Intro to Prob and Stats CHS Stats CHAPTER 2 REVIEW SUMMARIZING AND GRAPHING DATA MAIN IDEAS: Frequency Distributions, Relative Frequency Distributions, Cumulative Frequency Distributions Histograms Statistical Graphs (scatter plots, dot plots, stem plots, pie charts) Be able to understand and interpret results from frequency distributions and other graphs. STATISTICAL LITERACY AND CRITICAL THINKING: Investigating distribution of a data set – a histogram is more effective than a frequency distribution because a histogram provides a picture and a visual display is typically much easier to understand than the table of numbers. Comparing two data sets – a relative frequency distribution is better than a frequency distribution because relative frequencies use percentages rather than trying to compare data sets with significantly different data values. Histogram features indicating normal distribution – the bars start relatively low, increase to some maximum height, then decrease; symmetric with left half being roughly mirror image of the right half. REVIEW EXERCISES: 1. The following sample data set lists the number of minutes 50 Internet subscribers spent on the Internet during their most recent session. Construct a frequency distribution that has seven classes. 50 40 41 17 11 7 22 44 28 21 19 23 37 51 54 42 88 41 78 56 72 56 17 7 69 30 80 56 29 33 46 31 39 20 18 29 34 59 73 77 36 39 30 62 54 67 39 31 53 44 Time on Internet (min) Time Frequency (f) 7-18 19-30 31-42 43-54 55-66 67-78 79-90 Intro to Prob and Stats CHS Stats 2. Using the frequency distribution in Exercise 1 find the midpoint, relative frequency, and cumulative frequency for each class. Identify any patterns. Class 7-18 19-30 31-42 43-54 55-66 67-78 79-90 Frequency Distribution for Internet Usage (in minutes) Frequency, f Midpoint Relative Frequency Cumulative Frequency ∑𝑓 = ∑ 𝑓 = 𝑛 1 Interpretation: 3. Construct a frequency histogram for the frequency distribution in Exercise 1. Describe any patterns. Interpretation: 4. How would the histogram change if you were to construct a relative frequency histogram? 5. What can a scatter plot tell you about the data points graphed? Intro to Prob and Stats CHS Stats

