probability distribution function
advertisement
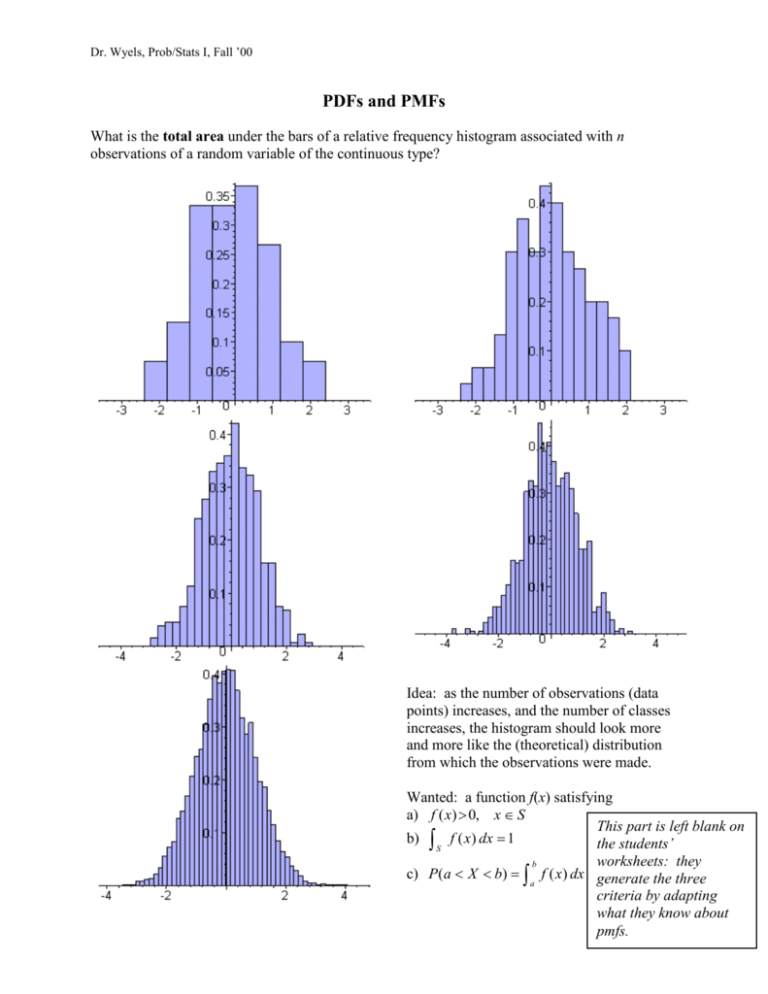
Dr. Wyels, Prob/Stats I, Fall ’00 PDFs and PMFs What is the total area under the bars of a relative frequency histogram associated with n observations of a random variable of the continuous type? Idea: as the number of observations (data points) increases, and the number of classes increases, the histogram should look more and more like the (theoretical) distribution from which the observations were made. Wanted: a function f(x) satisfying a) f ( x) 0, x S This part is left blank on b) f ( x) dx 1 the students’ S worksheets: they b c) P (a X b) f ( x) dx generate the three a criteria by adapting what they know about pmfs. Dr. Wyels, Prob/Stats I, Fall ’00 Discrete Distributions Probability Mass Function a) f ( x) 0, x S b) f ( x) 1 xS c) P( X ui ) f (ui ) pmf/ pdf (S is the space of possible outcomes.) Continuous Distributions Probability Distribution Function a) b) c) mean 2 variance 2 Find p (the 100pth percentile) by median, quartiles, percentiles p is a number for which Dr. Wyels, Prob/Stats I, Fall ’00 Discrete Distributions Probability Mass Function a) f ( x) 0, x S f ( x) 1 pmf/ pdf Continuous Distributions Probability Distribution Function a) f ( x) 0, x S (S is the space of possible outcomes.) b) xf ( x) mean xf ( x) dx 2 ( x ) 2 f ( x) x 2 f ( x) 2 variance b) xS c) P( X ui ) f (ui ) b c) P (a X b) f ( x) dx a S xS xS f ( x) dx 1 S xS Find p (the 100pth percentile) by taking the (n+1)pth “data point”. (Interpolate between data points as necessary.) 2 ( x ) 2 f ( x) dx x 2 f ( x) dx 2 S median, quartiles, percentiles S p is a number for which the area under the pdf to the p left of p is p. I.e. p f ( x) dx .
