Table 2 Characteristics of consenters and non
advertisement
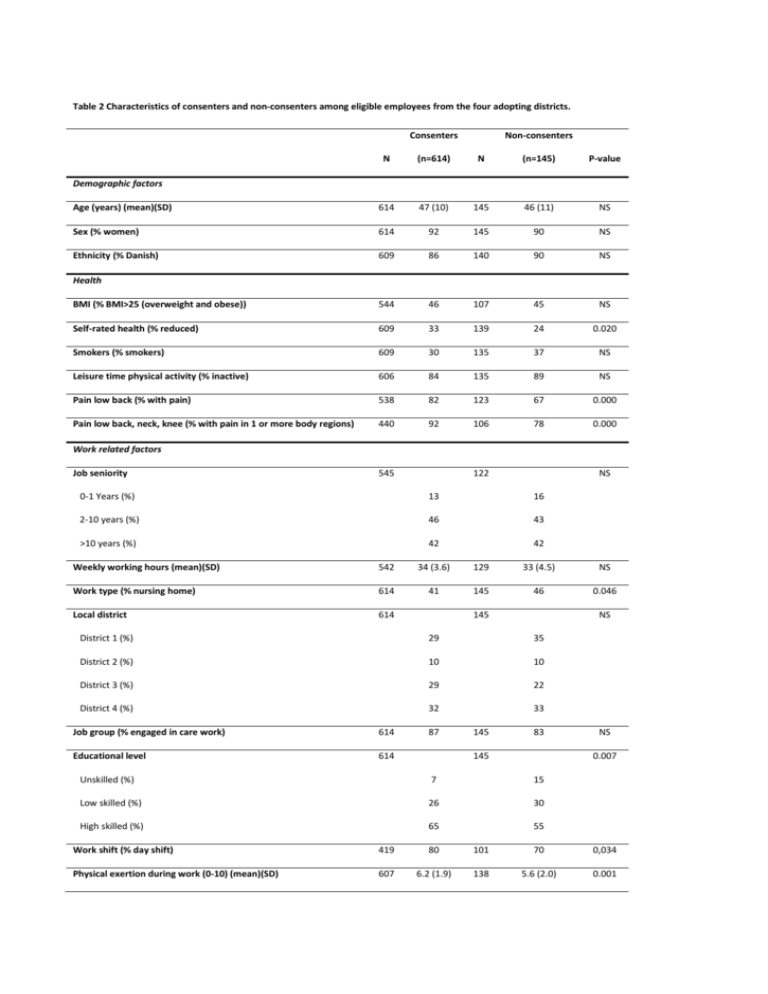
Table 2 Characteristics of consenters and non-consenters among eligible employees from the four adopting districts. Consenters Non-consenters N (n=614) N (n=145) P-value Age (years) (mean)(SD) 614 47 (10) 145 46 (11) NS Sex (% women) 614 92 145 90 NS Ethnicity (% Danish) 609 86 140 90 NS BMI (% BMI>25 (overweight and obese)) 544 46 107 45 NS Self-rated health (% reduced) 609 33 139 24 0.020 Smokers (% smokers) 609 30 135 37 NS Leisure time physical activity (% inactive) 606 84 135 89 NS Pain low back (% with pain) 538 82 123 67 0.000 Pain low back, neck, knee (% with pain in 1 or more body regions) 440 92 106 78 0.000 Demographic factors Health Work related factors Job seniority 545 122 NS 0-1 Years (%) 13 16 2-10 years (%) 46 43 >10 years (%) 42 42 Weekly working hours (mean)(SD) 542 34 (3.6) 129 33 (4.5) NS Work type (% nursing home) 614 41 145 46 0.046 Local district 614 145 NS District 1 (%) 29 35 District 2 (%) 10 10 District 3 (%) 29 22 District 4 (%) 32 33 Job group (% engaged in care work) 614 Educational level 614 87 145 83 145 NS 0.007 Unskilled (%) 7 15 Low skilled (%) 26 30 High skilled (%) 65 55 Work shift (% day shift) 419 80 101 70 0,034 Physical exertion during work (0-10) (mean)(SD) 607 6.2 (1.9) 138 5.6 (2.0) 0.001 Sickness absence previous 3 months (% yes) 574 42 128 34 NS Information about project (% with sufficient information) 605 92 137 87 NS Relevance of the project (% that finds the project relevant) 597 98 132 83 0.000 Project related factors


