Genetic Drift student handout
advertisement
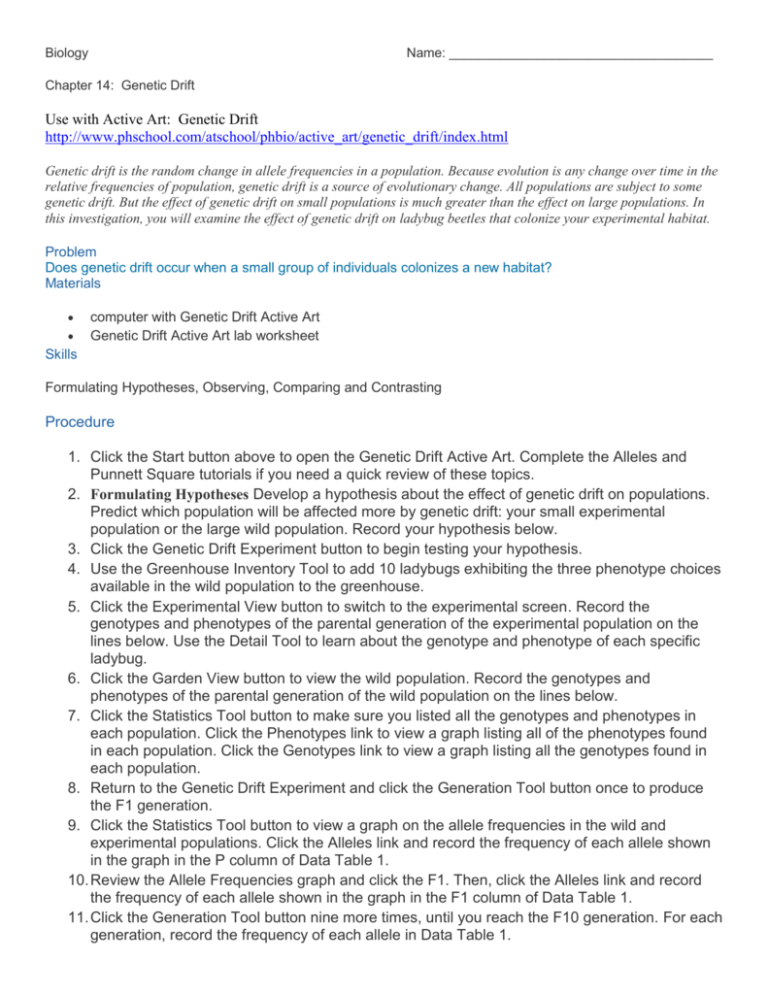
Biology Name: ____________________________________ Chapter 14: Genetic Drift Use with Active Art: Genetic Drift http://www.phschool.com/atschool/phbio/active_art/genetic_drift/index.html Genetic drift is the random change in allele frequencies in a population. Because evolution is any change over time in the relative frequencies of population, genetic drift is a source of evolutionary change. All populations are subject to some genetic drift. But the effect of genetic drift on small populations is much greater than the effect on large populations. In this investigation, you will examine the effect of genetic drift on ladybug beetles that colonize your experimental habitat. Problem Does genetic drift occur when a small group of individuals colonizes a new habitat? Materials computer with Genetic Drift Active Art Genetic Drift Active Art lab worksheet Skills Formulating Hypotheses, Observing, Comparing and Contrasting Procedure 1. Click the Start button above to open the Genetic Drift Active Art. Complete the Alleles and Punnett Square tutorials if you need a quick review of these topics. 2. Formulating Hypotheses Develop a hypothesis about the effect of genetic drift on populations. Predict which population will be affected more by genetic drift: your small experimental population or the large wild population. Record your hypothesis below. 3. Click the Genetic Drift Experiment button to begin testing your hypothesis. 4. Use the Greenhouse Inventory Tool to add 10 ladybugs exhibiting the three phenotype choices available in the wild population to the greenhouse. 5. Click the Experimental View button to switch to the experimental screen. Record the genotypes and phenotypes of the parental generation of the experimental population on the lines below. Use the Detail Tool to learn about the genotype and phenotype of each specific ladybug. 6. Click the Garden View button to view the wild population. Record the genotypes and phenotypes of the parental generation of the wild population on the lines below. 7. Click the Statistics Tool button to make sure you listed all the genotypes and phenotypes in each population. Click the Phenotypes link to view a graph listing all of the phenotypes found in each population. Click the Genotypes link to view a graph listing all the genotypes found in each population. 8. Return to the Genetic Drift Experiment and click the Generation Tool button once to produce the F1 generation. 9. Click the Statistics Tool button to view a graph on the allele frequencies in the wild and experimental populations. Click the Alleles link and record the frequency of each allele shown in the graph in the P column of Data Table 1. 10. Review the Allele Frequencies graph and click the F1. Then, click the Alleles link and record the frequency of each allele shown in the graph in the F1 column of Data Table 1. 11. Click the Generation Tool button nine more times, until you reach the F10 generation. For each generation, record the frequency of each allele in Data Table 1. Hypothesis Population Descriptions Wild Phenotypes: Wild Genotypes: Experimental Phenotypes: Experimental Genotypes: Data Table 1 Allele Frequency Changes P F1 F2 F3 F4 F5 F6 F7 F8 F9 F10 Wild s Allele Frequency Wild SA Analyze and Conclude Allele Frequency Experimental s Allele Frequency Experimental SA Allele Frequency 1. Observing Is there a difference between the P generation phenotypes of the wild population and the experimental population of the ladybug beetles? If so, what is the difference? o o 2. Applying Concepts What would a difference in allele frequencies in the P generation of the wild ladybug population and the P generation of the experimental ladybug population indicate? o o 3. Drawing Conclusions Did your observations support your hypothesis? Did genetic drift occur when your small group of ladybugs colonized the greenhouse? o o 4. Applying Concepts What would cause genetic drift between the wild ladybug population and the experimental ladybug population? o o 5. Analyzing Data Was there a change in allele frequencies over the 10 generations of the wild ladybug population? How did this change compare to the change in allele frequencies throughout the 10 generations of the experimental population? o o 6. Inferring Did evolution occur in either the wild ladybug population or the experimental ladybug population? If so, what is a cause of the evolution in each population? o o
