Appendix S2: The Linear Mixed Effects Model
advertisement
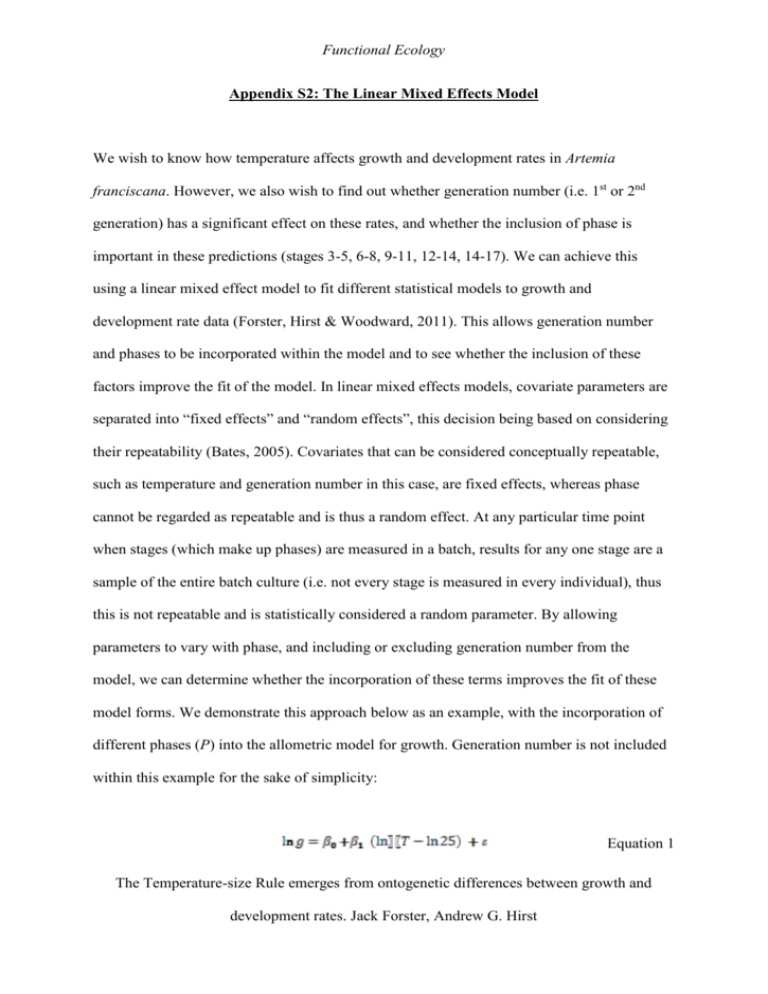
Functional Ecology Appendix S2: The Linear Mixed Effects Model We wish to know how temperature affects growth and development rates in Artemia franciscana. However, we also wish to find out whether generation number (i.e. 1st or 2nd generation) has a significant effect on these rates, and whether the inclusion of phase is important in these predictions (stages 3-5, 6-8, 9-11, 12-14, 14-17). We can achieve this using a linear mixed effect model to fit different statistical models to growth and development rate data (Forster, Hirst & Woodward, 2011). This allows generation number and phases to be incorporated within the model and to see whether the inclusion of these factors improve the fit of the model. In linear mixed effects models, covariate parameters are separated into “fixed effects” and “random effects”, this decision being based on considering their repeatability (Bates, 2005). Covariates that can be considered conceptually repeatable, such as temperature and generation number in this case, are fixed effects, whereas phase cannot be regarded as repeatable and is thus a random effect. At any particular time point when stages (which make up phases) are measured in a batch, results for any one stage are a sample of the entire batch culture (i.e. not every stage is measured in every individual), thus this is not repeatable and is statistically considered a random parameter. By allowing parameters to vary with phase, and including or excluding generation number from the model, we can determine whether the incorporation of these terms improves the fit of these model forms. We demonstrate this approach below as an example, with the incorporation of different phases (P) into the allometric model for growth. Generation number is not included within this example for the sake of simplicity: Equation 1 The Temperature-size Rule emerges from ontogenetic differences between growth and development rates. Jack Forster, Andrew G. Hirst Functional Ecology where g = growth rate (day-1), ß0 is the intercept parameter, ß1 is the slope parameter, T is temperature (°C) and ε is the error term. This statistical model is equivalent to the generalised least squares approach to fitting a model to data, where the best fit model is the point at which the error term is minimised. However, a linear mixed effects model allows variation in the other parameter terms to account for differences caused by random effects. For example, if we wish to allow variation in the model to account for differences in the intercept values of growth rates at different phases our model becomes: Equation 2 Equation 2.1 where the intercept term β0P includes a fixed term β0 along with a phase-specific intercept term (u0P). The intercept term can now vary to account for the differences driven by different phases. However, it may be that phase does not affect these intercept values but instead causes differences in the slope of natural-logged growth rate with temperature. This can also be incorporated within the linear mixed effects model: Equation 3 Equation 3.1 Where the slope term β1P includes a fixed term β1 along with a phase-specific slope term u1P. Finally, phase may impact on both the slope and intercept term, thus our best fit linear mixed effects model becomes: The Temperature-size Rule emerges from ontogenetic differences between growth and development rates. Jack Forster, Andrew G. Hirst Functional Ecology Equation 4 Equation 4.1 Equation 4.2 Therefore, for the effect of phase on the thermal response of growth rates there are three potential outcomes: a) phase-specific intercepts only; b) phase-specific slopes only; c) phasespecific slopes and intercepts. This exact process was repeated with development rate data also. We compared the fit of different potential models (i.e. including phase-specific slopes and intercepts applied to temperature, followed by inclusion or exclusion of generation number as a fixed parameter) for both growth and development, by conducting a likelihood ratio test using the ANOVA in the lme4 package in R 2.10.1, which calculates a conservative p-value (upper bound on the true p-value). The mixed effects model which gives the best fit for each type of statistical model (allometric, exponential and Arrhenius) was subsequently used for modelling growth and development rates. The Akaike weights were calculated for each model type, and revealed the allometric model to be the best fit model for both growth (with phase-specific slopes and intercepts, Akaike weight of 0.52) and development rates (with phase-specific intercepts only, Akaike weight of 0.53). The exponential and Arrhenius models were a poorer fit in all cases (Akaike weights <0.33). The Temperature-size Rule emerges from ontogenetic differences between growth and development rates. Jack Forster, Andrew G. Hirst Functional Ecology References Bates, D. (2005) Fitting linear mixed models in R. R News 5, 27-30. Forster, J., Hirst, A.G. & Woodward, G. (2011) Growth and development rates have different thermal responses. The American Naturalist 178, 668-678. The Temperature-size Rule emerges from ontogenetic differences between growth and development rates. Jack Forster, Andrew G. Hirst
