Table S1a: Variable used in the Monte Carlo
advertisement
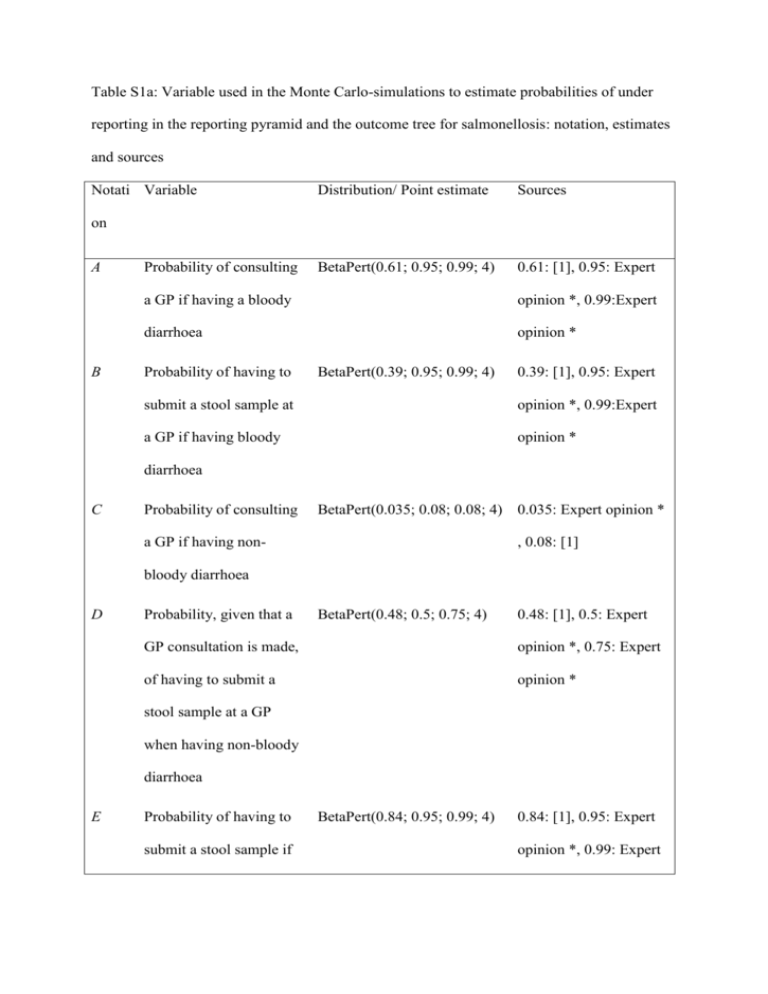
Table S1a: Variable used in the Monte Carlo-simulations to estimate probabilities of under reporting in the reporting pyramid and the outcome tree for salmonellosis: notation, estimates and sources Notati Variable Distribution/ Point estimate Sources BetaPert(0.61; 0.95; 0.99; 4) 0.61: [1], 0.95: Expert on A B Probability of consulting a GP if having a bloody opinion *, 0.99:Expert diarrhoea opinion * Probability of having to BetaPert(0.39; 0.95; 0.99; 4) 0.39: [1], 0.95: Expert submit a stool sample at opinion *, 0.99:Expert a GP if having bloody opinion * diarrhoea C Probability of consulting BetaPert(0.035; 0.08; 0.08; 4) 0.035: Expert opinion * a GP if having non- , 0.08: [1] bloody diarrhoea D Probability, given that a BetaPert(0.48; 0.5; 0.75; 4) 0.48: [1], 0.5: Expert GP consultation is made, opinion *, 0.75: Expert of having to submit a opinion * stool sample at a GP when having non-bloody diarrhoea E Probability of having to submit a stool sample if BetaPert(0.84; 0.95; 0.99; 4) 0.84: [1], 0.95: Expert opinion *, 0.99: Expert F hospitalized opinion * Probability that a positive 0.999 Expert opinion *** test result gets reported G Probability of submitted 0.99 Expert opinion ** 0.99 Expert opinion ** BetaPert(0.7; 0.8; 0.8; 4) 0.7: Expert opinion **, stool sample being analysed for Salmonella bacteria (GP) H Probability of submitted stool sample being analysed for Salmonella bacteria (hospital) I Probability of a positive test result if patient is 0.8: Expert opinion ** infected J Probability of getting Beta (2.06; 3.78) bloody diarrhoea if Fit distribution, see Appendix B for details having salmonellosis K L Probability of death due BetaPert(0.0044; 0.04; 0.0044: [2]**** , 0.04: to salmonellosis 0.04;4) [3] Number of reported Different point estimates Point estimate specific salmonellosis cases for each scenario according to Table 2 M Number of reported 449/3939*L 449:[4] for 2006 , hospitalized 3939:[5], mean for salmonellosis cases 2005-2008 * Based on four expert estimates:three County Medical Officers with long experience of infectious diseases and one epidemiologist from Smittskyddsinstitutet (SMI), with an extensive experience of gastrointestinal diseases. ** Based on two expert estimates: One chief microbiologist at the reference laboratory for EHEC, SMI and one epidemiologist from SMI, with an extensive experience of gastrointestinal diseases. *** Based on one expert estimate: An epidemiologist from SMI, with an extensive experience of gastrointestinal diseases. **** Mean yearly number with salmonellosis as main death cause (2000-09) / simulated number of cases in population Table S1b: Model used to estimate probabilities of underreporting in the reporting pyramid and the outcome tree for salmonellosis in the Monte Carlo-simulations, probabilities for those visiting a GP or being hospitalized Probabilities GP Hospitalized Sample taken J*B + (1-J)*D E Sample analysed for Salmonella G H Positive test result I I Result reported F F Probability that a case gets reported (J*B + (1-J)*D)*G*I*F E*H*I*F Real number of cases in population (l-M)/ ((J*B + (1- M/(E*H*I*F) (called RH that seek care J)*D)*G*I*F) (called below) RGP below) The probability of visiting a GP if you get salmonellosis is given by: J*A + (1-J)*C which implies that the true total number of cases in the population (including those that do not seek care) can be calculated as: (RGP+RH)/(J*A + (1-J)*C) (called RT below) The number of cases in the four different outcome classes can then be estimated as described in Table S1c. Table S1c: Model used to calculate the true number of human domestic salmonellosis cases in the different outcome classes Outcome class Number of cases Outcome class 1 (no care) RT-(RGP+RH) Outcome class 2 (GP only) RGP Outcome class 3 (GP and hospital) RH-RT*K Outcome class 4 (death) RT*K References (1) Haagsma J, Geenen P, Ethelberg S, Fetsch A, Hansdotter F, et al. (2012) Community incidence of pathogen-specific gastroenteritis: reconstructing the surveillance pyramid for seven pathogens in seven European Union member states. Epidemiology and Infection 1: 115. (2) Socialstyrelsen National Death Registry. (3) Mead PS, Slutsker L, Dietz V, McCaig LF, Bresee JS, et al. (1999) Food-related illness and death in the United States. Emerging Infectious Diseases 5: 607-625. (4) Socialstyrelsen National patient registry. (5) Smittskyddsinstitutet SmiNet, database of registered salmonellosis cases.
