NYS COMMON CORE MATHEMATICS CURRICULUM
Lesson 10
8•6
Lesson 10: Linear Models
Classwork
In previous lessons, you used data that follow a linear trend either in the positive direction or the negative direction and
informally fitted a line through the data. You determined the equation of an informal fitted line and used it to make
predictions.
In this lesson, you will use a function to model a linear relationship between two numerical variables and interpret the
slope and intercept of the linear model in the context of the data. Recall that a function is a rule that relates a
dependent variable to an independent variable.
In statistics, a dependent variable is also called a response variable or a predicted variable. An independent variable is
also called an explanatory variable or a predictor variable.
Example 1
Predicting the value of a numerical dependent (response) variable based on the value of a given numerical independent
variable has many applications in statistics. The first step in the process is to identify the dependent (predicted) variable
and the independent (predictor) variable.
There may be several independent variables that might be used to predict a given dependent variable. For example,
suppose you want to predict how well you are going to do on an upcoming statistics quiz. One possible independent
variable is how much time you spent studying for the quiz. What are some other possible numerical independent
variables that could relate to how well you are going to do on the quiz?
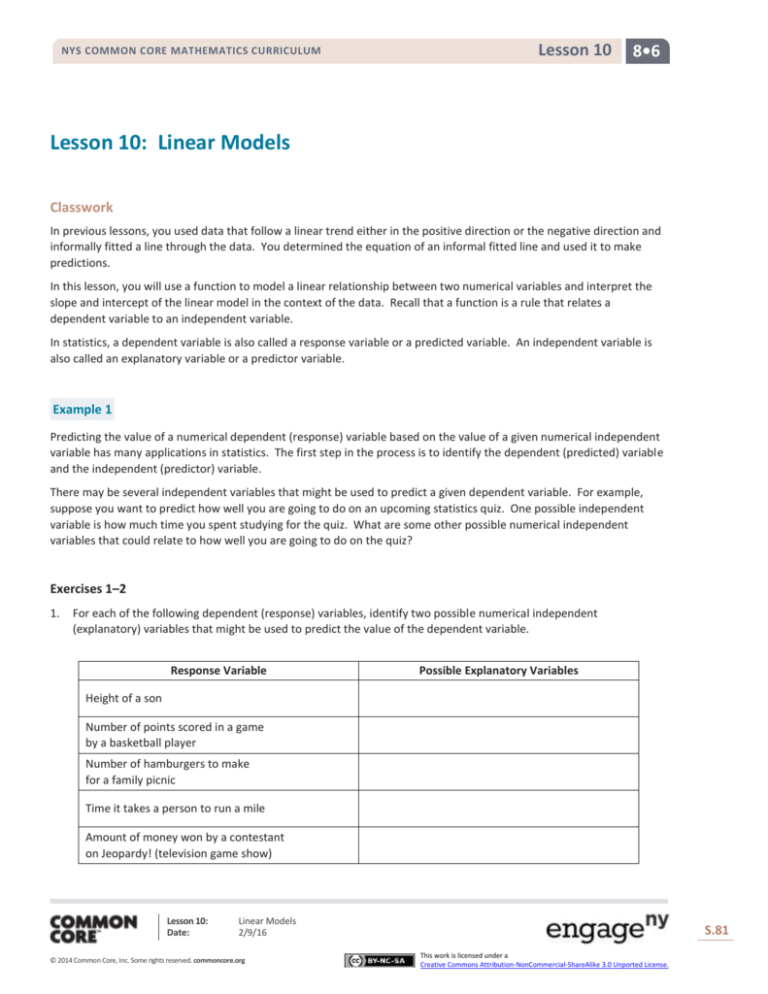
Exercises 1–2
1.
For each of the following dependent (response) variables, identify two possible numerical independent
(explanatory) variables that might be used to predict the value of the dependent variable.
Response Variable
Possible Explanatory Variables
Height of a son
Number of points scored in a game
by a basketball player
Number of hamburgers to make
for a family picnic
Time it takes a person to run a mile
Amount of money won by a contestant
on Jeopardy! (television game show)
Lesson 10:
Date:
Linear Models
2/9/16
© 2014 Common Core, Inc. Some rights reserved. commoncore.org
S.81
This work is licensed under a
Creative Commons Attribution-NonCommercial-ShareAlike 3.0 Unported License.
Lesson 10
NYS COMMON CORE MATHEMATICS CURRICULUM
Response Variable
8•6
Possible Explanatory Variables
Fuel efficiency (in miles per gallon) for a car
Number of honey bees in a beehive
at a particular time
Number of blooms on a dahlia plant
Number of forest fires in a state during a particular
year
2.
Now, reverse your thinking. For each of the following numerical independent variables, write a possible numerical
dependent variable.
Dependent Variable
Possible Independent Variables
Age of a student
Height of a golfer
Amount of a pain-reliever taken
Number of years of education
Amount of fertilizer used on a garden
Size of a diamond in a ring
Total salary for all of a team’s players
Lesson 10:
Date:
Linear Models
2/9/16
© 2014 Common Core, Inc. Some rights reserved. commoncore.org
S.82
This work is licensed under a
Creative Commons Attribution-NonCommercial-ShareAlike 3.0 Unported License.
Lesson 10
NYS COMMON CORE MATHEMATICS CURRICULUM
8•6
Example 2
A cell-phone company offers the following basic cell-phone plan to its customers: A customer pays a monthly fee of
$40.00. In addition, the customer pays $0.15 per text message sent from the cell phone. There is no limit to the
number of text messages per month that could be sent, and there is no charge for receiving text messages.
Exercises 3–11
3.
Determine the following:
a.
Justin never sends a text message. What would be his total monthly cost?
b.
During a typical month, Abbey sends 25 text messages. What is her total cost for a typical month?
c.
Robert sends at least 250 text messages a month. What would be an estimate of the least his total monthly
cost is likely to be?
4.
Use descriptive words to write a linear model describing the relationship between the number of text messages sent
and the total monthly cost.
5.
Is the relationship between the number of text messages sent and the total monthly cost linear? Explain your
answer.
Lesson 10:
Date:
Linear Models
2/9/16
© 2014 Common Core, Inc. Some rights reserved. commoncore.org
S.83
This work is licensed under a
Creative Commons Attribution-NonCommercial-ShareAlike 3.0 Unported License.
Lesson 10
NYS COMMON CORE MATHEMATICS CURRICULUM
8•6
6.
Let 𝑥 represent the independent variable and 𝑦 represent the dependent variable. Use the variables 𝑥 and 𝑦 to
write the function representing the relationship you indicated in Exercise 4.
7.
Explain what $0.15 represents in this relationship.
8.
Explain what $40.00 represents in this relationship.
9.
Sketch a graph of this relationship on the following coordinate grid. Clearly label the axes and include units in the
labels.
90
80
70
60
50
40
30
20
10
0
0
25
Lesson 10:
Date:
50
75
100
125
150
175
200
225
250
275
Linear Models
2/9/16
© 2014 Common Core, Inc. Some rights reserved. commoncore.org
S.84
This work is licensed under a
Creative Commons Attribution-NonCommercial-ShareAlike 3.0 Unported License.
Lesson 10
NYS COMMON CORE MATHEMATICS CURRICULUM
8•6
10. LaMoyne needs four more pieces of lumber for his scout project. The pieces can be cut from one large piece of
lumber according to the following pattern.
The lumberyard will make the cuts for LaMoyne at a fixed cost of $2.25 plus an additional cost of 25 cents per cut.
One cut is free.
a.
What is the functional relationship between the total cost of cutting a piece of lumber and the number of cuts
required? What is the equation of this function? Be sure to define the variables in the context of this
problem.
b.
Use the equation to determine LaMoyne’s total cost for cutting.
c.
In the context of this problem, interpret the slope of the equation in words.
d.
Interpret the 𝑦-intercept of your equation in words in the context of this problem. Does interpreting the
intercept make sense in this problem? Explain.
Lesson 10:
Date:
Linear Models
2/9/16
© 2014 Common Core, Inc. Some rights reserved. commoncore.org
S.85
This work is licensed under a
Creative Commons Attribution-NonCommercial-ShareAlike 3.0 Unported License.
Lesson 10
NYS COMMON CORE MATHEMATICS CURRICULUM
8•6
11. Omar and Olivia were curious about the size of coins. They measured the diameter and circumference of several
coins and found the following data.
US Coin
Penny
Nickel
Dime
Quarter
Half Dollar
Diameter (mm)
19.0
21.2
17.9
24.3
30.6
Circumference (mm)
59.7
66.6
56.2
76.3
96.1
a.
Wondering if there was any relationship between diameter and circumference, they thought about drawing a
picture. Draw a scatter plot that displays circumference in terms of diameter.
b.
Do you think that circumference and diameter are related? Explain.
Lesson 10:
Date:
Linear Models
2/9/16
© 2014 Common Core, Inc. Some rights reserved. commoncore.org
S.86
This work is licensed under a
Creative Commons Attribution-NonCommercial-ShareAlike 3.0 Unported License.
Lesson 10
NYS COMMON CORE MATHEMATICS CURRICULUM
c.
Find the equation of the function relating circumference to the diameter of a coin.
d.
The value of the slope is approximately equal to the value of 𝜋. Explain why this makes sense.
e.
What is the value of the 𝑦-intercept? Explain why this makes sense.
Lesson 10:
Date:
8•6
Linear Models
2/9/16
© 2014 Common Core, Inc. Some rights reserved. commoncore.org
S.87
This work is licensed under a
Creative Commons Attribution-NonCommercial-ShareAlike 3.0 Unported License.
Lesson 10
NYS COMMON CORE MATHEMATICS CURRICULUM
8•6
Lesson Summary
A linear functional relationship between a dependent and independent numerical variable has the form
𝑦 = 𝑚𝑥 + 𝑏 or 𝑦 = 𝑎 + 𝑏𝑥.
In statistics, a dependent variable is one that is predicted and an independent variable is the one that is
used to make the prediction.
The graph of a linear function describing the relationship between two variables is a line.
Problem Set
1.
2.
The Mathematics Club at your school is having a meeting. The advisor decides to bring bagels and his awardwinning strawberry cream cheese. To determine his cost, from past experience he figures 1.5 bagels per student. A
bagel costs 65 cents, and the special cream cheese costs $3.85 and will be able to serve all of the anticipated
students attending the meeting
a.
Find an equation that relates his total cost to the number of students he thinks will attend the meeting.
b.
In the context of the problem, interpret the slope of the equation in words.
c.
In the context of the problem, interpret the 𝑦-intercept of the equation in words. Does interpreting the
intercept make sense? Explain.
John, Dawn, and Ron get together to exercise (walk/jog) for 45 minutes. John has arthritic knees but manages to
1
1
2
4
walk 1 miles. Dawn walks 2 miles, while Ron manages to jog 6 miles.
a.
Draw an appropriate graph and connect the points to show that there is a linear relationship between the
distance that each traveled based on how fast each traveled (speed). Note that the speed for a person who
3
3
travels 3 miles in 45 minutes, or hours, is 3 ÷ = 4 miles per hour.
b.
Find an equation that expresses distance in terms of speed (how fast one goes).
c.
In the context of the problem, interpret the slope of the equation in words.
d.
In the context of the problem, interpret the 𝑦-intercept of the equation in words. Does interpreting the
intercept make sense? Explain.
4
Lesson 10:
Date:
4
Linear Models
2/9/16
© 2014 Common Core, Inc. Some rights reserved. commoncore.org
S.88
This work is licensed under a
Creative Commons Attribution-NonCommercial-ShareAlike 3.0 Unported License.
Lesson 10
NYS COMMON CORE MATHEMATICS CURRICULUM
3.
8•6
Simple interest is money that is paid on a loan. Simple interest is calculated by taking the amount of the loan and
multiplying it by the rate of interest per year and the number of years the loan is outstanding. For college, Jodie’s
older brother has taken out a student loan for $4,500 at an interest rate of 5.6%, or 0.056. When he graduates in
four years, he will have to pay back the loan amount plus interest for four years. Jodie is curious as to how much
her brother will have to pay.
a.
Jodie claims that his brother will have to pay her a total of $5,508. Do you agree? Explain. As an example, 8%
simple interest on $1,200 for one year is (0.08)($1200) = $96. The interest for two years would be 2 ×
$96, or $192.
b.
Write an equation for the total cost to repay a loan of $𝑃 if the rate of interest for a year is 𝑟 (expressed as a
decimal) for a time span of 𝑡 years.
c.
If 𝑃 and 𝑟 are known, is the equation a linear equation?
d.
In the context of the problem, interpret the slope of the equation in words.
e.
In the context of the problem, interpret the intercept of the equation in words. Does interpreting the
intercept make sense? Explain.
Lesson 10:
Date:
Linear Models
2/9/16
© 2014 Common Core, Inc. Some rights reserved. commoncore.org
S.89
This work is licensed under a
Creative Commons Attribution-NonCommercial-ShareAlike 3.0 Unported License.

