Lesson 16
NYS COMMON CORE MATHEMATICS CURRICULUM
7•5
Lesson 16: Methods for Selecting a Random Sample
Classwork
In this lesson, you will obtain random numbers to select a random sample. You will also design a plan for selecting a
random sample to answer a statistical question about a population.
Example 1: Sampling Children’s Books
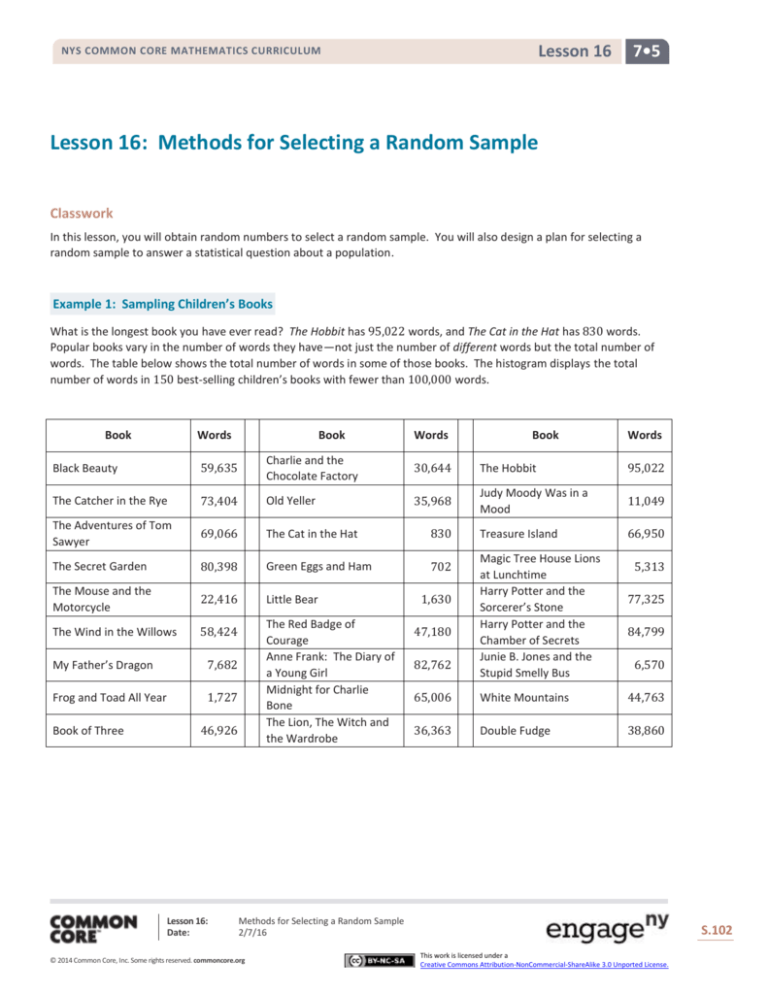
What is the longest book you have ever read? The Hobbit has 95,022 words, and The Cat in the Hat has 830 words.
Popular books vary in the number of words they have—not just the number of different words but the total number of
words. The table below shows the total number of words in some of those books. The histogram displays the total
number of words in 150 best-selling children’s books with fewer than 100,000 words.
Book
Words
Book
Words
Book
Words
Black Beauty
59,635
Charlie and the
Chocolate Factory
30,644
The Hobbit
95,022
The Catcher in the Rye
73,404
Old Yeller
35,968
Judy Moody Was in a
Mood
11,049
The Adventures of Tom
Sawyer
69,066
The Cat in the Hat
830
Treasure Island
66,950
The Secret Garden
80,398
Green Eggs and Ham
702
The Mouse and the
Motorcycle
22,416
Little Bear
The Wind in the Willows
58,424
My Father’s Dragon
7,682
Frog and Toad All Year
1,727
Book of Three
The Red Badge of
Courage
Anne Frank: The Diary of
a Young Girl
Midnight for Charlie
Bone
The Lion, The Witch and
the Wardrobe
46,926
Lesson 16:
Date:
1,630
47,180
82,762
Magic Tree House Lions
at Lunchtime
Harry Potter and the
Sorcerer’s Stone
Harry Potter and the
Chamber of Secrets
Junie B. Jones and the
Stupid Smelly Bus
5,313
77,325
84,799
6,570
65,006
White Mountains
44,763
36,363
Double Fudge
38,860
Methods for Selecting a Random Sample
2/7/16
© 2014 Common Core, Inc. Some rights reserved. commoncore.org
S.102
This work is licensed under a
Creative Commons Attribution-NonCommercial-ShareAlike 3.0 Unported License.
NYS COMMON CORE MATHEMATICS CURRICULUM
Lesson 16
7•5
Exercises 1–2
1.
From the table, choose two books with which you are familiar, and describe their locations in the data distribution
shown in the histogram.
2.
Put dots on the number line below that you think would represent a random sample of size 10 from the number of
words distribution above.
Lesson 16:
Date:
Methods for Selecting a Random Sample
2/7/16
© 2014 Common Core, Inc. Some rights reserved. commoncore.org
S.103
This work is licensed under a
Creative Commons Attribution-NonCommercial-ShareAlike 3.0 Unported License.
Lesson 16
NYS COMMON CORE MATHEMATICS CURRICULUM
7•5
Example 2: Using Random Numbers to Select a Sample
The histogram indicates the differences in the number of words in the collection of 150 books. How many words are
typical for a best-selling children’s book? Answering this question would involve collecting data, and there would be
variability in that data. This makes the question a statistical question. Think about the 150 books used to create the
histogram above as a population. How would you go about collecting data to determine the typical number of words for
the books in this population?
How would you choose a random sample from the collection of 150 books discussed in this lesson?
The data for the number of words in the 150 best-selling children’s books are listed below. Select a random sample of
the number of words for 10 books.
Books 1–10
59,635
82,762
92,410
75,340
8,234
59,705
92,409
75,338
8,230
82,768
Books 11–20
73,404
65,006
88,250
2,100
81,450
72,404
88,252
2,099
81,451
65,011
Books 21–30
69,066
36,363
75,000
3,000
80,798
69,165
75,012
3,010
80,790
36,361
Books 31–40
80,398
95,022
71,200
3,250
81,450
80,402
71,198
3,252
81,455
95,032
Books 41–50
22,416
11,049
81,400
3,100
83,475
22,476
81,388
3,101
83,472
11,047
Books 51–60
58,424
66,950
92,400
2,750
9,000
58,481
92,405
2,748
9,002
66,954
Books 61–70
7,682
5,313
83,000
87,000
89,170
7,675
83,021
87,008
89,167
5,311
Books 71–80
1,727
77,325
89,010
862
88,365
1,702
89,015
860
88,368
77,328
Books 81–90
46,926
84,799
88,045
927
89,790
46,986
88,042
926
89,766
84,796
Books 91–100
30,644
6,570
90,000
8,410
91,010
30,692
90,009
8,408
91,015
6,574
Books 101–110
35,968
44,763
89,210
510
9,247
35,940
89,213
512
9,249
44,766
Books 111–120
830
8,700
92,040
7,891
83,150
838
92,037
7,889
83,149
8,705
Books 121–130
702
92,410
94,505
38,860
81,110
712
94,503
87,797
81,111
92,412
Books 131–140
1,630
88,250
97,000
7,549
8,245
1,632
97,002
7,547
8,243
88,254
Books 141–150
47,180
75,000
89,241
81,234
8,735
47,192
89,239
81,238
8,739
75,010
Lesson 16:
Date:
Methods for Selecting a Random Sample
2/7/16
© 2014 Common Core, Inc. Some rights reserved. commoncore.org
S.104
This work is licensed under a
Creative Commons Attribution-NonCommercial-ShareAlike 3.0 Unported License.
NYS COMMON CORE MATHEMATICS CURRICULUM
Lesson 16
7•5
Exercises 3–6
3.
Follow your teacher’s instructions to generate a set of 10 random numbers. Find the total number of words
corresponding to each book identified by your random numbers.
4.
Choose two more different random samples of size 10 from the data, and make a dot plot of each of the three
samples.
5.
If your teacher randomly chooses 10 books from your summer vacation reading list, would you be likely to get many
books with a lot of words? Explain your thinking using statistical terms.
6.
If you were to compare your samples to your classmates’ samples, do you think your answer to Exercise 5 would
change? Why or why not?
Exercises 7–9: A Statistical Study of Balance and Grade
7.
Is the following question a statistical question: Do sixth graders or seventh graders tend to have better balance?
Why or why not?
Lesson 16:
Date:
Methods for Selecting a Random Sample
2/7/16
© 2014 Common Core, Inc. Some rights reserved. commoncore.org
S.105
This work is licensed under a
Creative Commons Attribution-NonCommercial-ShareAlike 3.0 Unported License.
NYS COMMON CORE MATHEMATICS CURRICULUM
8.
9.
Lesson 16
7•5
Berthio’s class decided to measure balance by finding out how long people can stand on one foot.
a.
How would you rephrase the question above to create a statistical question using this definition of balance?
Explain your reasoning.
b.
What should the class think about to be consistent in how they collect the data if they actually have people
stand on one foot and measure the time?
Work with your class to devise a plan to select a random sample of sixth graders and a random sample of seventh
graders to measure their balance using Berthio’s method. Then, write a paragraph describing how you will collect
data to determine whether there is a difference in how long sixth graders and seventh graders can stand on one
foot. Your plan should answer the following questions:
a.
What is the population? How will samples be selected from the population? And, why is it important that
they be random samples?
b.
How would you conduct the activity?
c.
What sample statistics will you calculate, and how will you display and analyze the data?
d.
What would you accept as evidence that there actually is a difference in how long sixth graders can stand on
one foot compared to seventh graders?
Lesson 16:
Date:
Methods for Selecting a Random Sample
2/7/16
© 2014 Common Core, Inc. Some rights reserved. commoncore.org
S.106
This work is licensed under a
Creative Commons Attribution-NonCommercial-ShareAlike 3.0 Unported License.
Lesson 16
NYS COMMON CORE MATHEMATICS CURRICULUM
7•5
Lesson Summary
In this lesson, you collected data on total number of words by selecting a random sample of children’s books. You
also observed that several different samples of the same size had some characteristics in common with each other
and with the population. In the second activity, you designed a statistical study. First, you considered a statistical
question. Then, you went through the statistical process beginning with the question and then thinking about how
to choose a random sample, how students would take part, what data you would collect to answer the question,
and how you would display and analyze the data.
Problem Set
1.
2.
3.
The suggestions below for how to choose a random sample of students at your school were made and vetoed.
Explain why you think each was vetoed.
a.
Use every fifth person you see in the hallway before class starts.
b.
Use all of the students taking math the same time as your class meets.
c.
Have students who come to school early do the activity before school starts.
d.
Have everyone in the class find two friends to be in the sample.
A teacher decided to collect homework from a random sample of her students, rather than grading every paper
every day.
a.
Describe how she might choose a random sample of five students from her class of 35 students.
b.
Suppose every day for 75 days throughout an entire semester she chooses a random sample of five students.
Do you think some students will never get selected? Why or why not?
Think back to earlier lessons in which you chose a random sample. Describe how you could have used a random
number generator to select a random sample in each case.
a.
A random sample of the words in the poem Casey at the Bat
b.
A random sample of the grocery prices on a weekly flyer
4.
Sofia decided to use a different plan for selecting a random sample of books from the population of 150 top-selling
children’s books from Example 2. She generated ten random numbers between 1 and 100,000 to stand for the
possible number of pages in any of the books. Then, she found the books that had the number of pages specified in
the sample. What would you say to Sofia?
5.
Find an example from a newspaper, magazine, or another source that used a sample. Describe the population, the
sample, the sample statistic, how you think the sample might have been chosen, and whether or not you think the
sample was random.
Lesson 16:
Date:
Methods for Selecting a Random Sample
2/7/16
© 2014 Common Core, Inc. Some rights reserved. commoncore.org
S.107
This work is licensed under a
Creative Commons Attribution-NonCommercial-ShareAlike 3.0 Unported License.

