Lesson 3
NYS COMMON CORE MATHEMATICS CURRICULUM
8•6
Lesson 3: Representations of a Line
Classwork
Example 1: Rate of Change and Initial Value Given in the Context of the Problem
Cost ($)
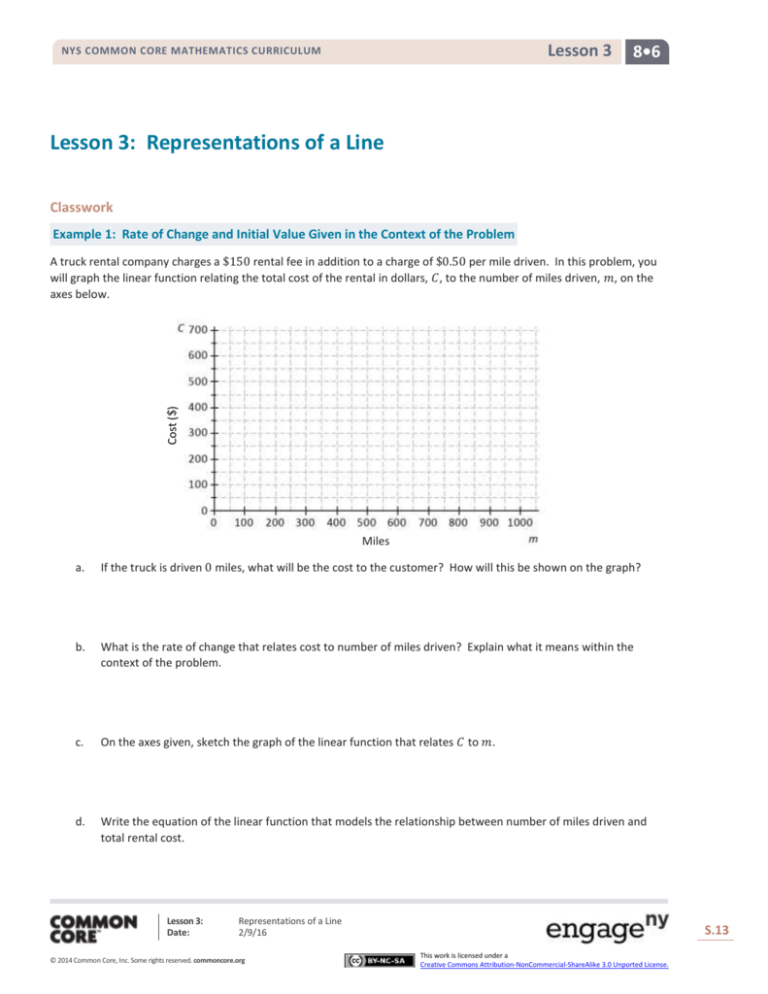
A truck rental company charges a $150 rental fee in addition to a charge of $0.50 per mile driven. In this problem, you
will graph the linear function relating the total cost of the rental in dollars, 𝐶, to the number of miles driven, 𝑚, on the
axes below.
Miles
a.
If the truck is driven 0 miles, what will be the cost to the customer? How will this be shown on the graph?
b.
What is the rate of change that relates cost to number of miles driven? Explain what it means within the
context of the problem.
c.
On the axes given, sketch the graph of the linear function that relates 𝐶 to 𝑚.
d.
Write the equation of the linear function that models the relationship between number of miles driven and
total rental cost.
Lesson 3:
Date:
Representations of a Line
2/9/16
© 2014 Common Core, Inc. Some rights reserved. commoncore.org
S.13
This work is licensed under a
Creative Commons Attribution-NonCommercial-ShareAlike 3.0 Unported License.
Lesson 3
NYS COMMON CORE MATHEMATICS CURRICULUM
8•6
Exercises
Value of the Car in Dollars
Jenna bought a used car for $18,000. She has been told that the value of the car is likely to decrease by $2,500 for each
year that she owns the car. Let the value of the car in dollars be 𝑉 and the number of years Jenna has owned the car be
𝑡.
Number of Years
1.
What is the value of the car when 𝑡 = 0? Show this point on the graph.
2.
What is the rate of change that relates 𝑉 to 𝑡? (Hint: Is it positive or negative? How can you tell?)
3.
Find the value of the car when
a.
𝑡 = 1.
b.
𝑡 = 2.
c.
𝑡 = 7.
4.
Plot the points for the values you found in Exercise 3, and draw the line (using a straight-edge) that passes through
those points.
5.
Write the linear function that models the relationship between the number of years Jenna has owned the car and
the value of the car.
Lesson 3:
Date:
Representations of a Line
2/9/16
© 2014 Common Core, Inc. Some rights reserved. commoncore.org
S.14
This work is licensed under a
Creative Commons Attribution-NonCommercial-ShareAlike 3.0 Unported License.
Lesson 3
NYS COMMON CORE MATHEMATICS CURRICULUM
8•6
An online bookseller has a new book in print. The company estimates that if the book is priced at $15, then 800 copies
of the book will be sold per day, and if the book is priced at $20, then 550 copies of the book will be sold per day.
6.
Identify the ordered pairs given in the problem. Then, plot both on the graph.
7.
Assume that the relationship between the number of books sold and the price is linear. (In other words, assume
that the graph is a straight line.) Using a straight-edge, draw the line that passes through the two points.
8.
What is the rate of change relating number of copies sold to price?
9.
Based on the graph, if the company prices the book at $18, about how many copies of the book can they expect to
sell per day?
10. Based on the graph, approximately what price should the company charge in order to sell 700 copies of the book
per day?
Lesson 3:
Date:
Representations of a Line
2/9/16
© 2014 Common Core, Inc. Some rights reserved. commoncore.org
S.15
This work is licensed under a
Creative Commons Attribution-NonCommercial-ShareAlike 3.0 Unported License.
Lesson 3
NYS COMMON CORE MATHEMATICS CURRICULUM
8•6
Lesson Summary
When the rate of change, 𝑏, and an initial value, 𝑎, are given in the context of a problem, the linear function that
models the situation is given by the equation 𝑦 = 𝑎 + 𝑏𝑥.
The rate of change and initial value can also be used to sketch the graph of the linear function that models the
situation.
When two or more ordered pairs are given in the context of a problem that involves a linear relationship, the graph
of the linear function is the line that passes through those points. The linear function can be represented by the
equation of that line.
Problem Set
1.
A plumbing company charges a service fee of $120, plus $40 for each hour worked. In this problem, you will sketch
the graph of the linear function relating the cost to the customer (in dollars), 𝐶, to the time worked by the plumber
(in hours), 𝑡, on the axes below.
C 400
Cost in Dollars
300
200
100
0
0
1
2
3
4
5
6
t
Time in Hours
a.
If the plumber works for 0 hours, what will be the cost to the customer? How will this be shown on the graph?
b.
What is the rate of change that relates cost to time?
c.
Write a linear function that models the relationship between the hours worked and cost to the customer.
d.
Find the cost to the customer if the plumber works for each of the following number of hours.
e.
i.
1 hour
ii.
2 hours
iii.
6 hours
Plot the points for these times on the coordinate plane, and use a straight-edge to draw the line through the
points.
Lesson 3:
Date:
Representations of a Line
2/9/16
© 2014 Common Core, Inc. Some rights reserved. commoncore.org
S.16
This work is licensed under a
Creative Commons Attribution-NonCommercial-ShareAlike 3.0 Unported License.
Lesson 3
NYS COMMON CORE MATHEMATICS CURRICULUM
2.
8•6
An author has been paid a writer’s fee of $1,000 and will additionally receive $1.50 for every copy of the book that
is sold.
Sketch the graph of the linear function that relates the total amount of money earned, 𝐴, to the number of
books sold, 𝑛, on the axes below.
Total Amount of Money Earned
a.
Number of Books Sold
b.
What is the rate of change that relates the total amount of money earned to the number of books sold?
c.
What is the initial value of the linear function based on the graph?
d.
Let the number of books sold be 𝑛 and the total amount earned be 𝐴. Construct a linear function that models
the relationship between the number of books sold and the total amount earned.
Lesson 3:
Date:
Representations of a Line
2/9/16
© 2014 Common Core, Inc. Some rights reserved. commoncore.org
S.17
This work is licensed under a
Creative Commons Attribution-NonCommercial-ShareAlike 3.0 Unported License.
Lesson 3
NYS COMMON CORE MATHEMATICS CURRICULUM
Suppose that the price of gasoline has been falling. At the beginning of last month (𝑡 = 0), the price was $4.60 per
gallon. Twenty days later (𝑡 = 20), the price was $4.20 per gallon. Assume that the price per gallon, 𝑃, fell at a
constant rate over the twenty days.
Price per Gallon
3.
8•6
Time in Days
a.
Identify the ordered pairs given in the problem. Plot both points on the coordinate plane above.
b.
Using a straight-edge, draw the line that contains the two points.
c.
What is the rate of change? What does it mean within the context of the problem?
d.
What is the function that models the relationship between the number of days and the price per gallon?
e.
What was the price of gasoline after 9 days?
f.
After how many days was the price $4.32?
Lesson 3:
Date:
Representations of a Line
2/9/16
© 2014 Common Core, Inc. Some rights reserved. commoncore.org
S.18
This work is licensed under a
Creative Commons Attribution-NonCommercial-ShareAlike 3.0 Unported License.

