ddi12018-sup-0001-AppendixS1
advertisement

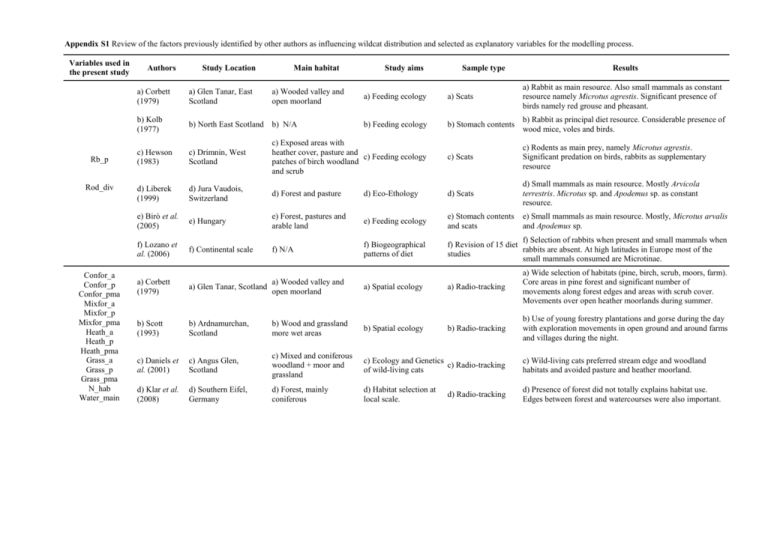
Appendix S1 Review of the factors previously identified by other authors as influencing wildcat distribution and selected as explanatory variables for the modelling process. Variables used in the present study Rb_p Rod_div Confor_a Confor_p Confor_pma Mixfor_a Mixfor_p Mixfor_pma Heath_a Heath_p Heath_pma Grass_a Grass_p Grass_pma N_hab Water_main Authors Study Location Main habitat Study aims Sample type Results a) Feeding ecology a) Scats a) Rabbit as main resource. Also small mammals as constant resource namely Microtus agrestis. Significant presence of birds namely red grouse and pheasant. b) Feeding ecology b) Stomach contents b) Rabbit as principal diet resource. Considerable presence of wood mice, voles and birds. c) Exposed areas with heather cover, pasture and c) Feeding ecology patches of birch woodland and scrub c) Scats c) Rodents as main prey, namely Microtus agrestis. Significant predation on birds, rabbits as supplementary resource d) Jura Vaudois, Switzerland d) Forest and pasture d) Eco-Ethology d) Scats d) Small mammals as main resource. Mostly Arvicola terrestris. Microtus sp. and Apodemus sp. as constant resource. e) Biró et al. (2005) e) Hungary e) Forest, pastures and arable land e) Feeding ecology e) Stomach contents and scats e) Small mammals as main resource. Mostly, Microtus arvalis and Apodemus sp. f) Lozano et al. (2006) f) Continental scale f) N/A f) Biogeographical patterns of diet f) Selection of rabbits when present and small mammals when f) Revision of 15 diet rabbits are absent. At high latitudes in Europe most of the studies small mammals consumed are Microtinae. a) Corbett (1979) a) Wooded valley and a) Glen Tanar, Scotland open moorland a) Spatial ecology a) Radio-tracking a) Wide selection of habitats (pine, birch, scrub, moors, farm). Core areas in pine forest and significant number of movements along forest edges and areas with scrub cover. Movements over open heather moorlands during summer. b) Scott (1993) b) Ardnamurchan, Scotland b) Wood and grassland more wet areas b) Spatial ecology b) Radio-tracking b) Use of young forestry plantations and gorse during the day with exploration movements in open ground and around farms and villages during the night. c) Daniels et al. (2001) c) Angus Glen, Scotland c) Mixed and coniferous woodland + moor and grassland c) Ecology and Genetics c) Radio-tracking of wild-living cats c) Wild-living cats preferred stream edge and woodland habitats and avoided pasture and heather moorland. d) Klar et al. (2008) d) Southern Eifel, Germany d) Forest, mainly coniferous d) Habitat selection at local scale. d) Presence of forest did not totally explains habitat use. Edges between forest and watercourses were also important. a) Corbett (1979) a) Glen Tanar, East Scotland a) Wooded valley and open moorland b) Kolb (1977) b) North East Scotland b) N/A c) Hewson (1983) c) Drimnin, West Scotland d) Liberek (1999) d) Radio-tracking Water_sec Variables used in the present study Urb_a Urb_p Urb_pma Rds_main Rds_sec Sport_est Elev_Range Mean_tc N/A – Not applicable e) Davis & Gray (2010) Authors e) Scotland (10x10km scale) Study Location e) Scottish wildcat survey (2006-08) e) NA Main habitat e) Wildcat sightings and interviews Study aims Sample type e) Sightings in grassland along river margins with scrub and tree cover. Results a) Scott (1993) a) Ardnamurchan, Scotland a) Wood and grassland more wet areas a) Spatial ecology a) Radio-tracking a) Movements around farms and villages during night. b) Klar et al. (2008) b) Southern Eifel, Germany b) Forest, mainly coniferous b) Habitat selection b) Radio-tracking b) Probability of wildcat habitat use decreases significantly near villages and moderately near roads and single houses. c) Davis & Gray (2010) c) Scotland (10x10km scale) c) N/A c) Scottish wildcat survey (2006-08) c) Wildcat sightings and interviews c) Records of wildcats were mostly found near human settlements and new housing developments. d) Ferreira et al. (2010) d) Iberian Peninsula d) N/A d) Large-scale d) Distribution data determinants of wildcat from Portugal and presence Spain atlas d) In Atlantic area, non-natural areas and road-length contributed positively for wildcat presence. Elevation range was the most important predictor. e) Jerosh et al. e) Harz Mountains, (2010) Germany e) Forest and Pastures e) Selection of resting sites e) Radio-tracking e) Wildcat can habituate to human-made structures, detection of resting sites near forest roads and motorways a) Corbett (1979) a) Wooded valley and open moorland a) Spatial ecology a) Radio-tracking a) Wildcats moved to lowland valleys during snow period. b) Mermod & b) Jura Mountains, Liberek Switzerland (2002) b) Forest, pasture and cultures b) The role of snow cover for wildcat b) Radio-tracking b) Wildcats use highland areas if vertical migration is possible and mostly during summer, after the snow disappearance. c) Daniels et al. (1998) c) Scotland c) N/A c) Morphological and pelage characteristics c) Road casualties; Predator control; Live-trapping c) Distribution of wild-living cats with characteristics normally associated with wildcat showed to be related with mean annual temperature d) Davis & Gray (2010) d) Scotland (10x10km scale) d) N/A d) Scottish wildcat survey (2006-08) d) Wildcat sightings and interviews d) Records were generally from lowland areas. a) Glen Tanar, Scotland Appendix S2 Models tested incorporating variables of each descriptor Model ΔAICc Akaike weight (wi) AIC AICc Rb_p + Rod_div 49.680 50.990 0.000 0.652 Rb_p + Rod_div + MSI 51.010 52.790 1.798 0.265 Rb_p + MSI 55.470 55.820 4.831 0.058 Rb_p 57.410 57.590 6.596 0.024 Rod_div 70.860 71.780 20.790 0.000 Rod_div + MSI 72.180 73.490 22.500 0.000 MSI 94.170 94.340 43.350 0.000 Null model 99.280 99.340 48.350 0.000 PC1 + PC2 + PC3 + MSI 88.690 89.610 0.000 0.237 PC2 + MSI 89.390 89.750 0.135 0.221 PC2 + PC3 + MSI 89.230 89.830 0.219 0.212 PC1 + PC2 + MSI 89.600 90.210 0.595 0.176 PC1 + PC2 + PC3 93.350 93.950 4.341 0.027 MSI 94.170 94.340 4.730 0.022 PC3 + MSI 94.250 94.610 4.993 0.019 PC1 + MSI 94.450 94.810 5.196 0.018 PC1 + PC3 + MSI 94.220 94.820 5.209 0.017 PC2 + PC3 94.590 94.950 5.339 0.016 PC1 + PC2 94.920 95.280 5.667 0.014 PC2 95.890 96.070 6.455 0.009 PC1+PC3 97.430 97.790 8.179 0.004 PC3 98.300 98.480 8.865 0.003 PC1 98.490 98.660 9.052 0.003 Null model 99.280 99.340 9.728 0.002 Urb_a + Sport_est + MSI 71.710 72.320 0.000 0.313 Sport_est + MSI 72.160 72.520 0.197 0.284 Rds_main + Sport_est + MSI 72.040 72.650 0.330 0.265 Urb_a + Rds_main + Sport_est + MSI 73.170 74.090 1.771 0.129 Urb_a + MSI 81.880 82.240 9.922 0.002 Urb_a + Sport_est 82.410 82.770 10.450 0.002 Urb_a + Rds_main + MSI 82.750 83.360 11.040 0.001 Urb_a + Rds_main + Sport_est 82.920 83.530 11.210 0.001 Rds_main + Sport_est 83.330 83.690 11.370 0.001 Urb_a 85.080 85.250 12.930 0.000 Urb_a + Rds_main 85.470 85.820 13.510 0.000 Sport_est 86.420 86.600 14.280 0.000 Rds_main + MSI 87.290 87.640 15.320 0.000 Rds_main 90.340 90.520 18.200 0.000 MSI 94.170 94.340 22.020 0.000 Null model 99.280 99.340 27.020 0.000 Prey diversity Land cover Disturbance Topography and climate Mean_tc + Elev_range + MSI 74.440 75.040 0.000 0.787 Mean_tc + MSI 78.680 79.040 3.996 0.107 Elev_range + MSI 78.710 79.070 4.027 0.105 Mean_tc + Elev_range 89.010 89.370 14.330 0.001 Elev_range 89.680 89.860 14.820 0.000 Mean_tc 90.690 90.860 15.820 0.000 MSI 94.170 94.340 19.300 0.000 Null model 99.280 99.340 24.300 0.000 Appendix S3 Variables representing each descriptor in the combined models. Descriptor Variables Rb_p Prey diversity Land cover Disturbance Topography and climate Averaged Selected estimates variables 2.310 Rod_div 1 -0.953 Rod_div 2 2.280 Rod_div 3 2.720 Rod_div 4 1.550 Rb_p, Rod_div PC1 -0.430 PC2 -1.440 PC2 PC3 -0.486 Sport_est -3.180 Rds_main 0.381 Sport_est Urb_a 0.606 Elev_Range Mean_tc -1.740 Elev_Range 1.700


