Lab: Genetic Variety and Natural Selection
advertisement
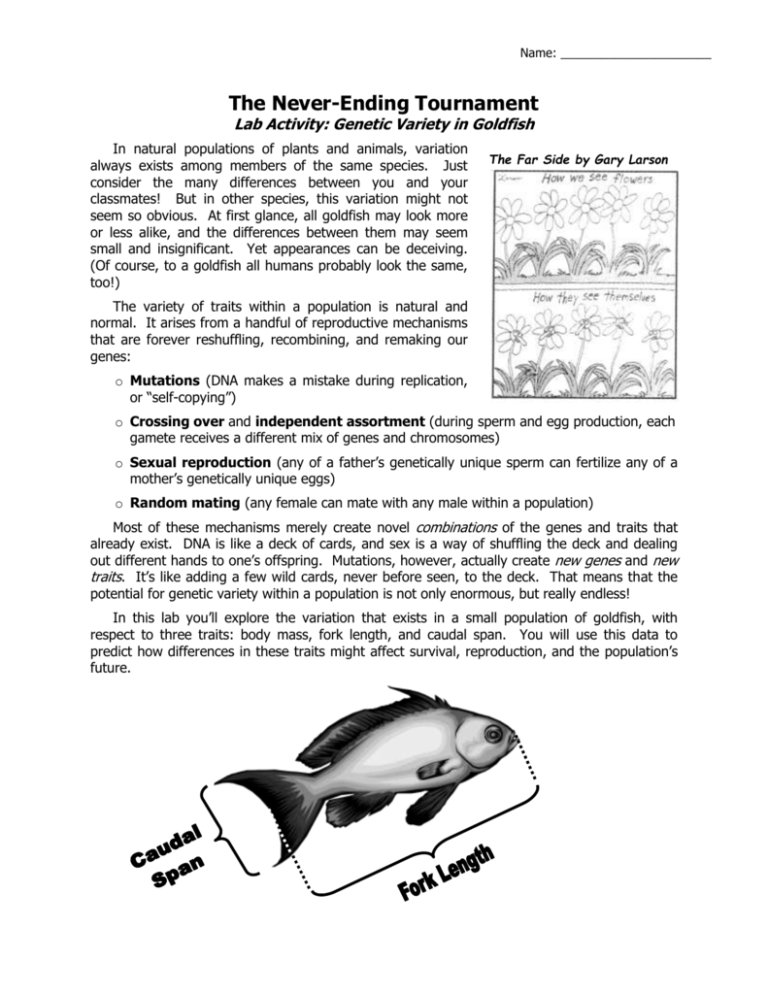
Name: ______________________ The Never-Ending Tournament Lab Activity: Genetic Variety in Goldfish In natural populations of plants and animals, variation always exists among members of the same species. Just consider the many differences between you and your classmates! But in other species, this variation might not seem so obvious. At first glance, all goldfish may look more or less alike, and the differences between them may seem small and insignificant. Yet appearances can be deceiving. (Of course, to a goldfish all humans probably look the same, too!) The Far Side by Gary Larson The variety of traits within a population is natural and normal. It arises from a handful of reproductive mechanisms that are forever reshuffling, recombining, and remaking our genes: o Mutations (DNA makes a mistake during replication, or “self-copying”) o Crossing over and independent assortment (during sperm and egg production, each gamete receives a different mix of genes and chromosomes) o Sexual reproduction (any of a father’s genetically unique sperm can fertilize any of a mother’s genetically unique eggs) o Random mating (any female can mate with any male within a population) Most of these mechanisms merely create novel combinations of the genes and traits that already exist. DNA is like a deck of cards, and sex is a way of shuffling the deck and dealing out different hands to one’s offspring. Mutations, however, actually create new genes and new traits. It’s like adding a few wild cards, never before seen, to the deck. That means that the potential for genetic variety within a population is not only enormous, but really endless! In this lab you’ll explore the variation that exists in a small population of goldfish, with respect to three traits: body mass, fork length, and caudal span. You will use this data to predict how differences in these traits might affect survival, reproduction, and the population’s future. Procedure 1. Proceed to the first aquarium and use a dip net to obtain one goldfish. Place it in a petri dish and take it to your lab table. (Don’t worry – the fish won’t suffocate. Goldfish were chosen for this lab because they are hardy and can withstand several minutes out of water. Even so, make your measurements as swiftly as possible. And be nice to the fish!) 2. Accurately measure to the nearest millimeter (not centimeters!) the fish’s caudal span, the height of the tail from tip to tip (see diagram). Try to fan the tail open in a natural way, not spread unnaturally wide, yet not folded up like fan. For reference, have a look at the caudal fins of goldfish still swimming in the tank. Record data in the table below. 3. Now measure the fish’s fork length, the distance in millimeters from the tip of the nose to the crook where the tail’s upper and lower lobe meet (see diagram). 4. Finally, measure the fish’s body mass to the nearest tenth of a gram. Don’t forget to subtract the weight of the dish! 5. Return goldfish to the second aquarium (so as not to measure the same fish twice). 6. Repeat steps 1-5 for nine more goldfish. 7. Now for each fish, calculate two indices of tail size relative to overall body size: (a) the ratio of caudal span to fork length, which we’ll call the “Tail-to-Length Ratio” and express as a percent, and (b) the ratio of caudal span to body mass, which we’ll call the “Tail-to-Weight Ratio” and express in millimeters per gram. Use these formulas: Tail-to-Length Ratio Caudal Width (mm) = 100% Fork Length (mm) (expressed as a percent) Tail-to-Weight Ratio Caudal Width (mm) = Body Mass (g) (expressed in mm/g) DATA TABLE Fish number 1 2 3 4 5 6 7 8 9 10 Caudal span (mm) Fork length (mm) Body Mass (g) Tail-to-Length Ratio (%) Length Class (rounded to nearest 5%) Tail-to-Mass Ratio (mm/g) Weight Class (rounded to nearest even #) 2 8. Round your raw Tail-to-Length Ratios to the nearest 5% and record as “Length Class.” Round your Tail-to-Mass Ratios, to the nearest even number and record as “Weight Class.” 9. Tally your Length Class and Weight Class data on the board for all 10 fish. 10. Once data for the entire population of goldfish is up on the board, construct two histograms of the whole class data, one for Length Class, one for Weight Class. A histogram is just a bar graph that plots the frequency (y-axis) of each trait (x-axis) in the population. Class Data (all fish) Weight Class Frequency 2 4 6 8 10 12 14 16 18 20 22 24 26 28 Frequency Histogram of Length Class Length Class (%) Histogram of Weight Class Frequency Class Data (all fish) Length Class Frequency 5 10 15 20 25 30 35 40 45 50 55 60 65 70 75 80 Weight Class (mm/g) 3 Analysis & Interpretation 1. What is the Mean Length Class for the entire population of goldfish? What is the Mean Weight class? (The “mean” is the average. You can use the histogram to figure this out: (a) multiply each length by its frequency in the population, (b) add all these products together, and (c) divide by the total number fish in the population.) 2. What is the Modal Length Class for the entire population? The Modal Weight Class? (The “mode” is the most frequent or most common value.) 3. In any species of plant or animal, you can measure almost any trait and you will usually get a bell-shaped distribution of frequencies. Both the mean and mode will typically occur near the peak of the bell, and as you move left or right away from the mean and mode, the traits will diminish in frequency. The lowest frequencies will usually occur at the “tails” of the range of traits. Roughly speaking, does the goldfish data obey this pattern? Describe. 4. The tail size of each goldfish (relative to its body length and weight) is probably a polygenic trait, influenced by multiple genes at multiple loci on multiple chromosomes. As you can see, this trait varies, and so therefore do the underlying genes. Now, pet store goldfish are raised in captivity where the size of a fish’s tail matters little to its survival. But suppose we were to release this population of goldfish into a wild habitat, like a freshwater pond. In the wild, which fish from your histograms would you predict to survive longest? Why? Describe some situations where you predict tail size could affect a fish’s odds of survival. 5. Given your prediction in #4 above, which goldfish will be able to produce more offspring? Why? 6. Given your predictions in #4 and #5 above, what would probably happen to the Mean and Modal tail ratios over many generations? Explain your reasoning. At the level of genes for tail size, what would be happening? 4 Frequency 6000 4000 2000 0 0 10 20 30 40 50 Tail-to-Body Ratio, Present Day Frequency 6000 4000 2000 0 0 10 20 30 40 50 Tail-to-Body Ratio in 500 Generations 6000 Frequency 7. The distribution of traits in a wild population very often takes the shape of a “bell curve,” like the one on the right. This shows that most members of the population have traits that are fairly “average,” yet a few have traits toward the extremes. Draw curves in the second two graphs that are consistent with your prediction in #6 above. Be careful! Make certain you know what the vertical y-axis IS (the frequency of each size class) and what it ISN’T (it’s NOT tail size). For the purpose of this exercise, let’s assume that this is a stable population of goldfish, with each fish that dies being replaced by exactly one newborn. In that case, the TOTAL number of goldfish in the pond wouldn’t change much from generation to generation, even though the trait distribution might. 4000 2000 0 0 10 20 30 40 50 Tail-to-Body Ratio in 1,000 Generations 8. Look around. If you were to measure the height of your classmates, would it plot out as a bell curve? Now suppose a diabolical biology teacher locks your entire class in a gymnasium without any bleachers, tables, etc. There’s nothing in there except basketball goals. Then he or she releases into the gym a huge pack of starving, bloodthirsty miniature poodles. Which classmates would be most likely to survive this ordeal and live long enough to pass on their height genes? Explain. Suppose instead that this insane, sadistic teacher locks you all in a cafeteria that is empty except for some doghouses scattered about. Then, rather than poodles, he or she releases a gang of ferocious, hungry, lumbering Barney dinosaurs. Now who would make it? Why? The Moral: What REALLY determines whether a particular trait is “good” or “bad,” beneficial or harmful? 5
