catalase lab report-m.orhun şahin
advertisement
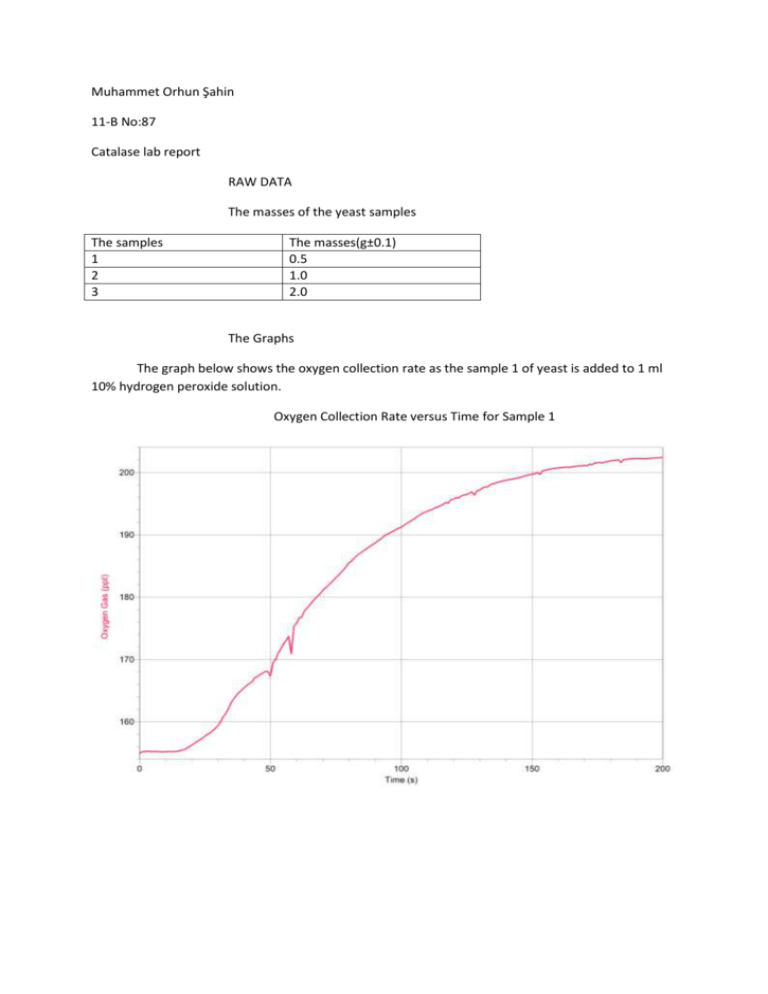
Muhammet Orhun Şahin 11-B No:87 Catalase lab report RAW DATA The masses of the yeast samples The samples 1 2 3 The masses(g±0.1) 0.5 1.0 2.0 The Graphs The graph below shows the oxygen collection rate as the sample 1 of yeast is added to 1 ml 10% hydrogen peroxide solution. Oxygen Collection Rate versus Time for Sample 1 The graph below shows the oxygen collection rate when sample 2 of the yeast is added to 1 ml 10% hydrogen peroxide solution. Oxygen Collection Rate versus Time for Sample 2 The graph below shows the oxygen collection rate when sample 3 of the yeast is added to 1 ml 10% hydrogen peroxide solution. Oxygen Collection Rate versus Time for Sample 3 CONCLUSION AND EVALUATION CONCLUSION As discovered by the above results, as the yeast amount increases the collected oxygen gas volume increases for samples 1 and 2. For both, the graph increases steeply at first, then the graph becomes horizontal. There is a decelerating increase for both. The same case is also valid for the sample 3. But when we compare sample 2 and 3 there is no big difference except for instantaneous fluctuations which are probably caused by random errors. The reason why oxygen is produced is that the catalase enzyme in yeast converts hydrogen peroxide into oxygen and water. As the hydrogen peroxide concentration decreases the rate of the reaction decreases so the graphs flatten. Also more oxygen is produced in sample 2 than sample 1. The total collected oxygen amount is almost 250 ppt for experiment 2 and 210 ppt for experiment 1. Because in sample 2 there are more yeast which means there is more catalase enzyme so more oxygen is produced. But the same case is not true for sample 3. The total collected oxygen amount is almost 280 ppt for experiment 2 and 280 ppt for experiment 3. Although sample 3 has more yeast, thus more catalase enzyme, the collected oxygen amount is not bigger than that of sample 2. This may be because the all the substrate, hydrogen peroxide solution, has been being acted on by the sample 2 already so all the substrate is saturated by enzyme. Therefore increasing enzyme amount doesn’t increase the collected oxygen amount. EVALUATION Overall, I am confident about my data as there are only a few errors. I could get a more reliable data set if I had done the experiment with a larger range of samples and more repetitions. The main weakness of the experiment is that some oxygen escaped from the apparatus without being collected. This error is obvious when we look at the graphs because we notice some zigzags caused by the oxygen escape. Another weakness of the experiment is that the range of the yeast samples could be larger. Also the apparatus gets hotter during the experiment because of the respiration of the yeast and the increase in temperature changes the activity of the catalase enzyme, causing errors. IMPROVEMENTS To improve the mentioned weaknesses, I should have used a water bath to keep the yeast under constant temperature. I should have placed the flask containing yeast into the water bath which was set to a constant temperature like 30 centigrade degrees. Also I could use some plasters to prevent the oxygen escape. I could have covered the junction of the flask containing the yeast and the delivery tube with plasters and minimize the oxygen escape.
