Dynamic Equilibrium POGIL
advertisement
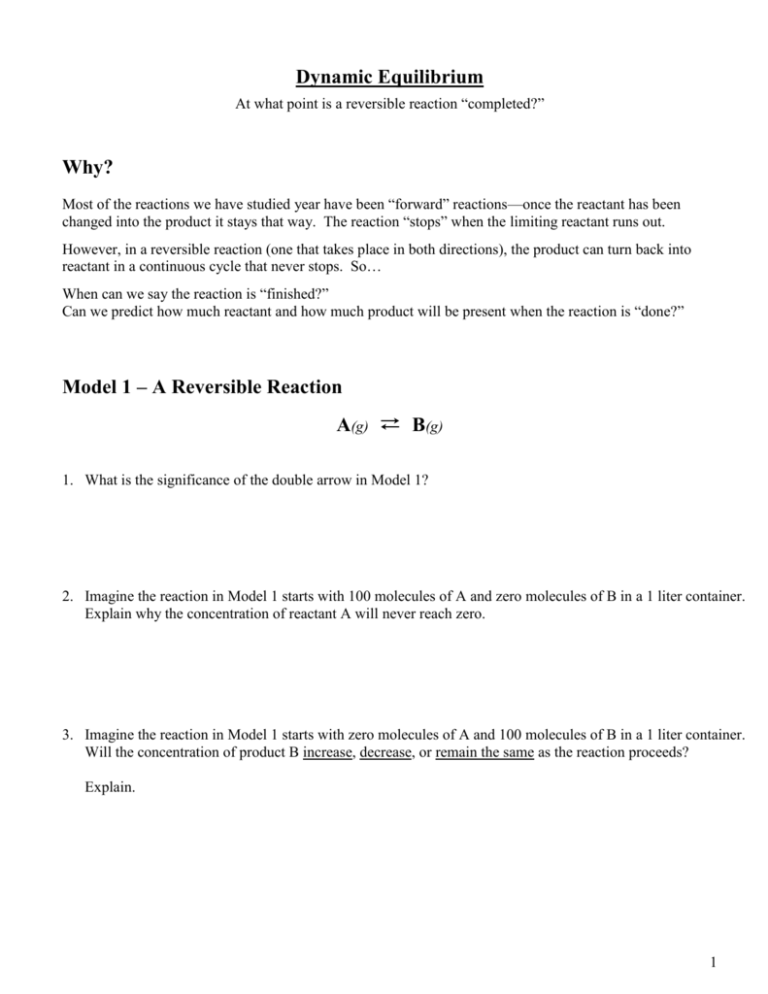
Dynamic Equilibrium At what point is a reversible reaction “completed?” Why? Most of the reactions we have studied year have been “forward” reactions—once the reactant has been changed into the product it stays that way. The reaction “stops” when the limiting reactant runs out. However, in a reversible reaction (one that takes place in both directions), the product can turn back into reactant in a continuous cycle that never stops. So… When can we say the reaction is “finished?” Can we predict how much reactant and how much product will be present when the reaction is “done?” Model 1 – A Reversible Reaction A(g) ⇄ B(g) 1. What is the significance of the double arrow in Model 1? 2. Imagine the reaction in Model 1 starts with 100 molecules of A and zero molecules of B in a 1 liter container. Explain why the concentration of reactant A will never reach zero. 3. Imagine the reaction in Model 1 starts with zero molecules of A and 100 molecules of B in a 1 liter container. Will the concentration of product B increase, decrease, or remain the same as the reaction proceeds? Explain. 1 Read This! (seriously…read this carefully) Reversible reactions never come to an end: they just reach equilibrium. That is, they reach a point when there is no further change in concentrations of reactants or products. The forward and reverse reactions continue to occur (dynamic), but at the same rate so that the overall amounts of reactants and products remain constant (equilibrium). Model 2 – Chemical Equilibrium The data table below shows the moles of A and B in a 1 liter container over a period of time in a system that initially contains only reactant A. A(g) Time (min) ⇄ B(g) Concentration Concentration of A (M) of B (M) 0 10.00 0 1 6.00 4.00 2 3.20 6.80 3 2.64 7.36 4 2.53 7.47 5 2.51 7.49 6 2.50 7.50 7 2.50 7.50 8 2.50 7.50 9 2.50 7.50 10 2.50 7.50 4. At what time in Model 2 does the system reach equilibrium? 5. Based on the data in Model 2, does the reaction reach equilibrium when the moles of A are equal to the moles of B? 6. After equilibrium was reached, what is true about the amount of moles of reactant A and moles of product B? 7. What is “equal” when a reaction reaches equilibrium? 2 8. Using the data from Model 2, make a line graph below by plotting the moles of A and B each minute. Moles of Reactants A and Products B over time 9. How does the shape of the moles vs. time graph communicate that the equilibrium has been reached? 10. As the concentration of a substances decreases, the rate at which it reacts decreases because the collisions between particles occur less frequently. During the first 5 minutes of the reaction in Model 2, the forward rate at which A becomes B is… (circle one) getting faster (increasing) , getting slower (decreasing) , staying the same (constant) ? During the first 5 minutes of the reaction in Model 2, the reverse rate at which B becomes A is… (circle one) getting faster (increasing) , getting slower (decreasing) , staying the same (constant) ? 11. During the last 5 minutes of the reaction in Model 2, compare the forward and reverse rates of reaction. Fill in the blank with greater than (>), less than (<), or equal to (=): rateforward ___ ratereverse 3 Extension Questions 1. The following diagrams represent a hypothetical reaction X ⇄ Y . The sequence from left to right represents the system as time passes. Do the diagrams indicate that the system reaches equilibrium? X X X X X X X X X X X X Y Y Y X X X Y Y Y Y X X X X Y X X Y X Y X Y X X Y X X Y X X X Y Y Y X Y X Y If Yes, in which diagram is equilibrium reached and how could you tell? If No, how can you tell it did not reach equilibrium yet? 2. A mixture of 0.10 mol of NO , 0.50 mol of H2 , and 0.10 mol of H2O is placed in a 1.0 L vessel and allowed to reach equilibrium shown the reaction below: 2 NO(g) + 2 H2(g) ⇄ N2(g) + 2 H2O(g) At equilibrium, there are 0.062 mol NO. Calculate the equilibrium amounts of H2 , N2 , and H2O . 4
