Lactation Curves
advertisement
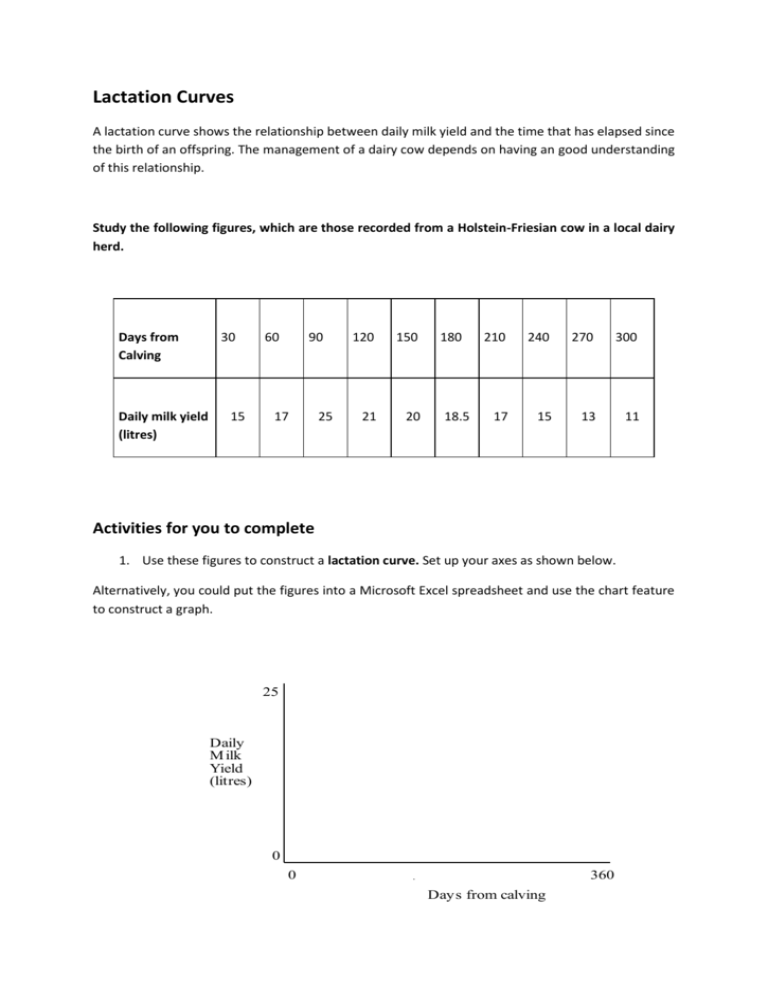
Lactation Curves A lactation curve shows the relationship between daily milk yield and the time that has elapsed since the birth of an offspring. The management of a dairy cow depends on having an good understanding of this relationship. Study the following figures, which are those recorded from a Holstein-Friesian cow in a local dairy herd. Days from Calving Daily milk yield (litres) 30 15 60 90 17 25 120 150 21 20 180 18.5 210 240 270 300 17 15 13 11 Activities for you to complete 1. Use these figures to construct a lactation curve. Set up your axes as shown below. Alternatively, you could put the figures into a Microsoft Excel spreadsheet and use the chart feature to construct a graph. 25 Daily M ilk Yield (litres) 0 0 360 Days from calving 2. Put an appropriate heading on your curve. 3. Explain why the curve has the shape you have drawn. 4. Use labelled arrows to indicate the times when the dairy farmer should try to time each of the following events: a) have the cow mated again b) dry the cow off (stop milking her) c) have the cow calve again 5. Sketch the expected lactation curve of a Jersey cow on your axes. Label both the HolsteinFriesian and Jersey curves clearly. 6. In NSW most dairy farmers aim to produce approximately the same volume of milk each week throughout the year. Explain how they would need to organise the pattern of reproduction in their herds to achieve this.

