bit25696-sup-0001-SuppData-S1
advertisement
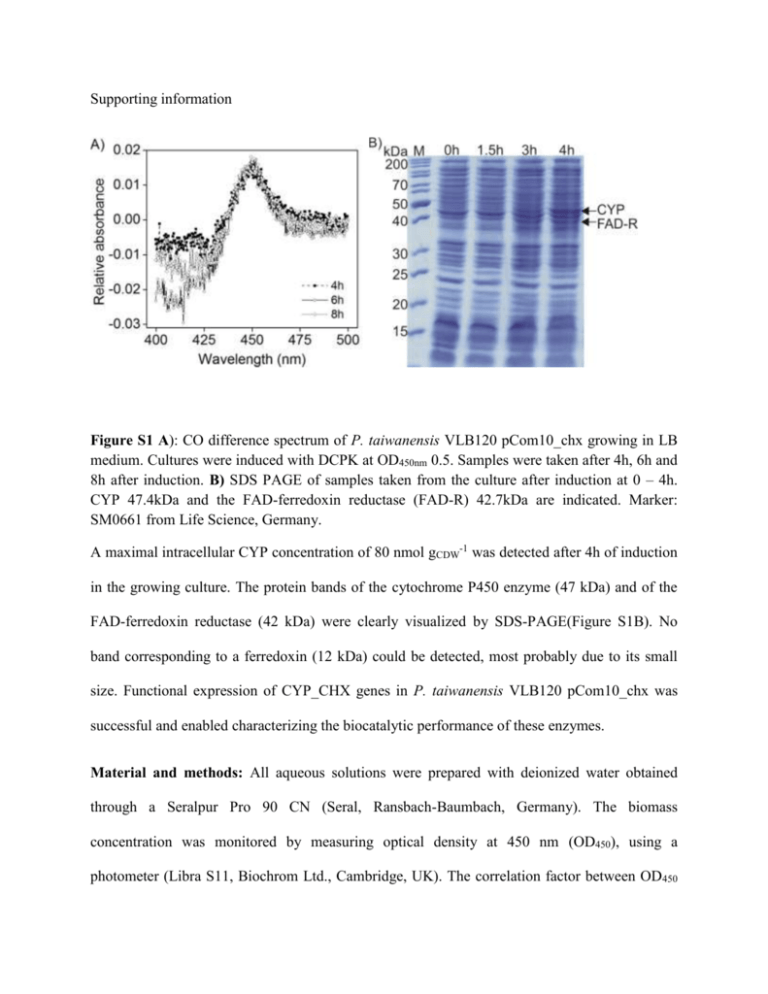
Supporting information Figure S1 A): CO difference spectrum of P. taiwanensis VLB120 pCom10_chx growing in LB medium. Cultures were induced with DCPK at OD450nm 0.5. Samples were taken after 4h, 6h and 8h after induction. B) SDS PAGE of samples taken from the culture after induction at 0 – 4h. CYP 47.4kDa and the FAD-ferredoxin reductase (FAD-R) 42.7kDa are indicated. Marker: SM0661 from Life Science, Germany. A maximal intracellular CYP concentration of 80 nmol gCDW-1 was detected after 4h of induction in the growing culture. The protein bands of the cytochrome P450 enzyme (47 kDa) and of the FAD-ferredoxin reductase (42 kDa) were clearly visualized by SDS-PAGE(Figure S1B). No band corresponding to a ferredoxin (12 kDa) could be detected, most probably due to its small size. Functional expression of CYP_CHX genes in P. taiwanensis VLB120 pCom10_chx was successful and enabled characterizing the biocatalytic performance of these enzymes. Material and methods: All aqueous solutions were prepared with deionized water obtained through a Seralpur Pro 90 CN (Seral, Ransbach-Baumbach, Germany). The biomass concentration was monitored by measuring optical density at 450 nm (OD450), using a photometer (Libra S11, Biochrom Ltd., Cambridge, UK). The correlation factor between OD450 and cell dry weight (CDW) concentration was deduced from Blank et al., 2008, where 1 OD450 corresponds to 0.166, 0.233 and 0.186 for E.coli, P.putida and P. taiwanensis, respectively. Acidovorax sp. CHX100 was grown as described by Salamanca et al., 2015. Protein concentration was measured by the method given by Bradford (Bradford 1976), using the quick start Bradford dye (Bio-Rad, Munich, Germany), with a standard curve prepared using bovine serum albumin. Genome sequencing and annotation: Genomic DNA was isolated from Acidovorax CHX100 using a peqGOLD Bacterial DNA Kit (Peqlab, Erlangen, Germany). Genome sequencing and automated annotation was carried out by CeBiTec and the genome was integrated into the platform GenDB (Meyer et al. 2003). Visualization of cell permeabilization: Propidium iodide dye PI (Invitrogen, OR) was used to stain permeabilized cells. P. taiwanensis VLB120 pCom10_chx cells were induced and harvested after 4h, as described above. Subsequently, cells at 0.5 gCDW L-1 were incubated in 15 mL Pyrex tubes and in the presence of 100 mM cyclohexane in 1 mL 50 mM Kpi buffer pH 7.4 containing 1% citrate. After 10 min, cells were centrifuged at 4°C, 4595 g, 10 minutes (Thermo Electron Corporation, Langenselbold, Germany) and resuspended in 1 mL 50 mM Kpi buffer pH 7.4, supplemented with 1% citrate. Propidium iodide, 1 µL, was added and after 20 minutes of incubation, the cells were washed in 50 mM Kpi buffer pH 7.4. Permeabilized cells were inspected at 535 nm excitation and 617 nm emission using a Zeiss LSM5 Pascal confocal laser scanning microscope (CLSM; Carl Zeiss, Jena Geramny) as described by Halan and co-workers (Halan et al. 2011). References: Bradford MM. 1976. A rapid and sensitive method for the quantitation of microgram quantities of protein utilizing the principle of protein-dye binding. Analytical Biochemistry 72(12):248-254. Meyer F, Goesmann A, McHardy AC, Bartels D, Bekel T, Clausen J, Kalinowski J, Linke B, Rupp O, Giegerich R and others. 2003. GenDB—an open source genome annotation system for prokaryote genomes. Nucleic Acids Research 31(8):2187-2195. Halan B, Schmid A, Buehler K. 2011. Real-Time Solvent Tolerance Analysis of Pseudomonas sp. Strain VLB120ΔC Catalytic Biofilms. Applied and Environmental Microbiology 77(5):1563-1571.

