Section 2: Bleeding event definitions based on INTERMACS
advertisement
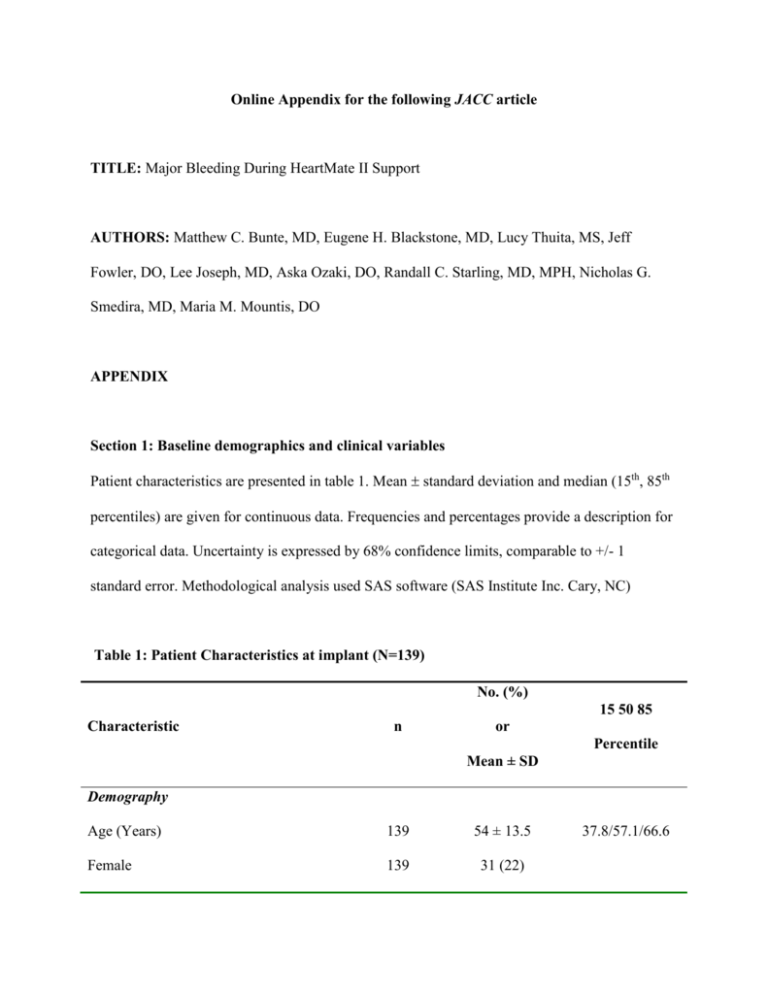
Online Appendix for the following JACC article TITLE: Major Bleeding During HeartMate II Support AUTHORS: Matthew C. Bunte, MD, Eugene H. Blackstone, MD, Lucy Thuita, MS, Jeff Fowler, DO, Lee Joseph, MD, Aska Ozaki, DO, Randall C. Starling, MD, MPH, Nicholas G. Smedira, MD, Maria M. Mountis, DO APPENDIX Section 1: Baseline demographics and clinical variables Patient characteristics are presented in table 1. Mean standard deviation and median (15th, 85th percentiles) are given for continuous data. Frequencies and percentages provide a description for categorical data. Uncertainty is expressed by 68% confidence limits, comparable to +/- 1 standard error. Methodological analysis used SAS software (SAS Institute Inc. Cary, NC) Table 1: Patient Characteristics at implant (N=139) No. (%) 15 50 85 Characteristic n or Percentile Mean ± SD Demography Age (Years) 139 54 ± 13.5 Female 139 31 (22) 37.8/57.1/66.6 Race 139 Caucasian 108 (78) African-American 27 (19) Other 4 (2.9) Height (cm) 139 174 ± 10.7 163/175/185 Weight (kg) 139 85.1 ± 22.4 62.2/84.4/105 Weight Height Ratio 139 0.49 ± 0.11 0.36/0.48/0.58 Body Mass Index 139 27.8 ± 6.18 21/27.2/33 Body Surface Area(m2) 139 2.04 ± 0.31 1.72/2.04/2.31 Coronary Artery Disease 139 65 (47) Dilated Cardiomyopathy 139 59 (42) Hypertrophic cardiomyopathy 139 11 (7.9) Valvular heart disease 139 4 (2.9) Smoking 139 80 (58) Smoking 6mths before surgery 139 4 (2.9) Alcohol 139 33 (24) Cocaine/Marijuana 139 13 (9.4) Atrial Fibrillation 139 53 (38) Stroke/CVA 139 15 (11) DVT 139 8 (5.8) Primary Diagnosis Psychosocial Issues Cardiac comorbidity history MI 139 61 (44) MI within 6weeks before surgery 118 15 (13) Thoracic surgery 139 2 (1.4) Hypertension 139 73 (53) GI Bleed 139 4 (2.9) Malignancy 139 11 (7.9) Albumin (g/dL) 133 3.45 ± 0.64 Hyperlipidemia 139 71 (51) Glucose 98 115 ± 44.8 Diabetes 139 56 (40) Preop Hemoglobin A1C 58 6.46 ± 1 5.6/6.25/7.12 BUN (mg∙dL-1) 138 34.3 ± 19.7 16.9/30/53.2 Serum creatinine (mg∙dL-1) 138 1.4 ± 0.53 0.9/1.32/2 Creatinine clearance (Cockcroft-Gault) 138 85.4 ± 82.5 40/71.9/119 Glomerular filtration rate (MDRD) 138 72.1 ± 91.7 36.1/59.8/89.1 Chronic Renal Disease, No Dialysis 139 19 (14) Dialysis 139 29 (21) Non-cardiac comorbidity/History Nutrition 2.7/3.5/4.1 84/103/143 Renal function Sodium 115 133 ± 5.35 127/134/138 Liver function Serum total bilirubin (mg∙dL-1) 138 1.47 ± 1.26 0.6/1.05/2.4 Serum Glut. Oxalo Trans. SGOT 109 62.4 ± 88.9 20.5/34/90.5 Serum Glut. Pynevic Trans. SGPT 109 72.2 ± 153 14/34/97 Hematocrit (%) 138 33.7 ± 5.91 27.5/33.5/40.6 Hemoglobin 135 10.9 ± 2.08 8.7/10.8/13.2 Transfusions 139 15 (11) Diastolic BP 132 59.8 ± 10.1 50/60/70 Systolic BP 132 96.4 ± 14.6 82/95.5/109 Mean BP 132 72 ± 10.5 62/71.5/82.7 PAP-Diastolic 136 24.2 ± 7.72 16/24/32 PAP-Systolic 136 47.9 ± 14.9 30.6/48/64 PAP-Mean 136 32.1 ± 9.28 22/32/42 Heart Rate 127 90.6 ± 17.8 73.2/90/111 Cardiac index 117 2.24 ± 0.63 1.6/2.2/2.83 INR 112 1.22 ± 0.34 1/1.1/1.4 Prothrombin Time (Secs) 111 13.3 ± 3.5 11.2/12.2/15 Partial Thromboplastin Time (Secs) 109 42.7 ± 23.3 28.5/32.9/61.6 Aspirin 139 74(53) Thienopyridine (i.e., clopidogrel, 139 15 (11) Serology Blood Pressure Hemodynamics Clotting Preop Medications ticlopidine) Warfarin 139 Strategies 139 52 (37) Bridge to transplant 55 (40) Bridge to decision 53 (38) Destination therapy 31 (22) INTERMACs Level 139 INTERMACs Enrolled 139 74 (53) INTERMACs level 1 46 (33) INTERMACs level 2 30 (22) INTERMACs level 3 28 (20) INTERMACs level 4 33 (24) INTERMACs level 5 2 (1.4) Life Support 139 ECMO life support 14 (10) IABP life support 44 (32) Inotrope life support 85 (61) VENT life support 19 (14) Preoperative ICU 139 91 (65) 139 96.1 ± 36 63/92/124 133 14.9 ± 4.72 10/15/20 Intraoperatives CPB- minutes ECHO Ejection fraction Left atrial diameter 122 4.91 ± 0.91 4/5/5.7 Unscaled LA volume 122 68.6 ± 42.5 33.5/65.5/97 Calc LV mass (ASE-cube mass) 126 336 ± 125 232/323/440 LV end diastolic volume 126 251 ± 90 167/239/326 LV end systolic volume 125 192 ± 84.7 111/187/281 Calc LV eject fraction (echo est) 125 24.7 ± 13.9 13.2/21.6/36.8 AV stenosis degree 35 0.74 ± 1.63 0/ 0/2.8 AV mean gradient 12 14.7 ± 7.09 5.95/12.5/23.1 Initial VAD flow 115 4.9 ± 0.91 4/4.7/5.92 Initial VAD Pulsatility Index 122 4.94 ± 0.97 3.85/5/6 Initial VAD speed 137 8720 ± 471 8200/8800/9200 Days: Admission to implant 139 13 ± 13.8 3/10/23 Interval: 1/1/2004 to HeartMate II 139 5.02 ± 1.04 4.29/5.22/6.03 VAD settings Time intervals Postoperative Events n Overall transplant 45 Overall death 44 Causes of death Anoxia 1 Cardiac arrest 1 Hemorrhage non stroke 7 Infections 9 Liver failure 1 Multiple organ failure 14 Other cerebral/HF 6 Stroke 2 Unknown 3 Section 2: Bleeding event definitions based on INTERMACS adverse event criteria. Modifications made to INTERMACS-defined adverse events included reclassification of hemorrhagic stroke as a major bleeding event and an additional category of anemia of undetermined source (AUS). AUS events were used to account for clinically significant anemia requiring transfusion when a conspicuous source of blood loss was absent. Major bleeding: A confirmed source of bleeding resulting in: 1. Death; 2. Reoperation; 3. Rehospitalization; 4. Hemorrhagic stroke; 5. Transfusion; a. ≥4 units PRBCs within 7 days of surgery b. Any transfusion beyond 7 days from surgery Anemia of undetermined source: A clinically significant non-hemolytic anemia meeting above INTERMACS transfusion requirements, plus indeterminate primary source of bleeding despite noninvasive or invasive testing Section 3: Assessment of INR profile and modeling risk of INR on bleeding. a) Trend: General postoperative INR description The table below indicates the number of INR records beyond 1day, 7days, 1month, 3, 6, 9, 12, 15, 18, and 24 months. For analyses, INR measurements were considered through 15 months. The median time from last INR to subsequent bleeding complication was 1 day (1 - 8 days, 15th and 85th percentile). The mean time (and standard deviation) from last INR to bleeding was 4.6±7.9 days. Table 3a: Available INR data over 24 months follow-up. Number (#) at risk indicates patients at risk for bleeding at the listed time interval. One patient did not have an available postoperative INR record. # INR records indicates the total number of cumulative INR records available for all patients beyond the listed time point. 1 1 1 3 6 9 12 15 18 24 day week mo mo mo mo mo mo mo mo 138 138 132 121 99 74 56 41 24 13 5 8145 8027 7309 4939 2930 1894 1252 784 470 261 37 Total # at risk # INR records #: number; mo: month When INR was considered in the multivariable model, early implant year and prolonged bypass time remained significant risk factors for combined bleeding,. Although elevated INR was a significant risk factor for bleeding events in univariable analysis, this effect disappeared in the multivariable model. Table 3b: Incremental risk factors for ALL bleeding combined. Multiphase hazard regression was used in a multivariable model to isolate risk factors for all bleeding. Because INR was the focus of this section of subanalysis, exceptions were made for bootstrapped INR value and bootstrapped time to INR measurement: these variables were forced into each phase of the multivariable model, irrespective of reaching the prespecified 50% reliability or alpha ≤ 0.07 significance levels. Parametric estimates were obtained from a multiphase hazard function model of time-related events. Early HeartMate II implant year and prolonged bypass time were predictors of bleeding in the early hazard phase. Earlier implant year remained a significant predictor of bleeding into the late hazard phase. INR was not a significant risk factor in either early or late hazard phases. Factors Coefficient + SE p-value R* INR 0.17 + 0.11 0.1 87 HeartMate II implant year -7.13 + 2.96 0.02 69 Cardiopulmonary bypass time 0.66 + 0.19 0.0005 74 INR -0.038 + 0.13 0.8 35 HeartMate II implant year -0.56 + 0.087 <0.0001 56 Early Hazard Phase Late Hazard Phase * Reliability: % of occurrence of factors in the 500-bootstrapped model Section 4: Hazard function for death among the overall cohort (excluding destination therapy). The hazard curve illustrates the instantaneous risk of death after HeartMate II implant, excluding those implanted as destination therapy. Solid lines are parametric estimates enclosed within 68% confidence limits. Hazard of death rose steeply immediately after implant, reaching its peak at 7 days, followed by a steep fall and leveling off at 2 weeks. Section 5: Bleeding incidence by preoperative INTERMACS score. HMII recipients with the highest acuity INTERMACS score of 1 experienced the greatest rates of early and long-term incident bleeding complications. Overall, INTERMACS score trended poorly with incident bleeding events. HMII recipients with an INTERMACS score of 4 and 5 were combined due to a small number of patients.
