Pearson’s Correlation Results Presentation
8. APA Style Presentation of Results
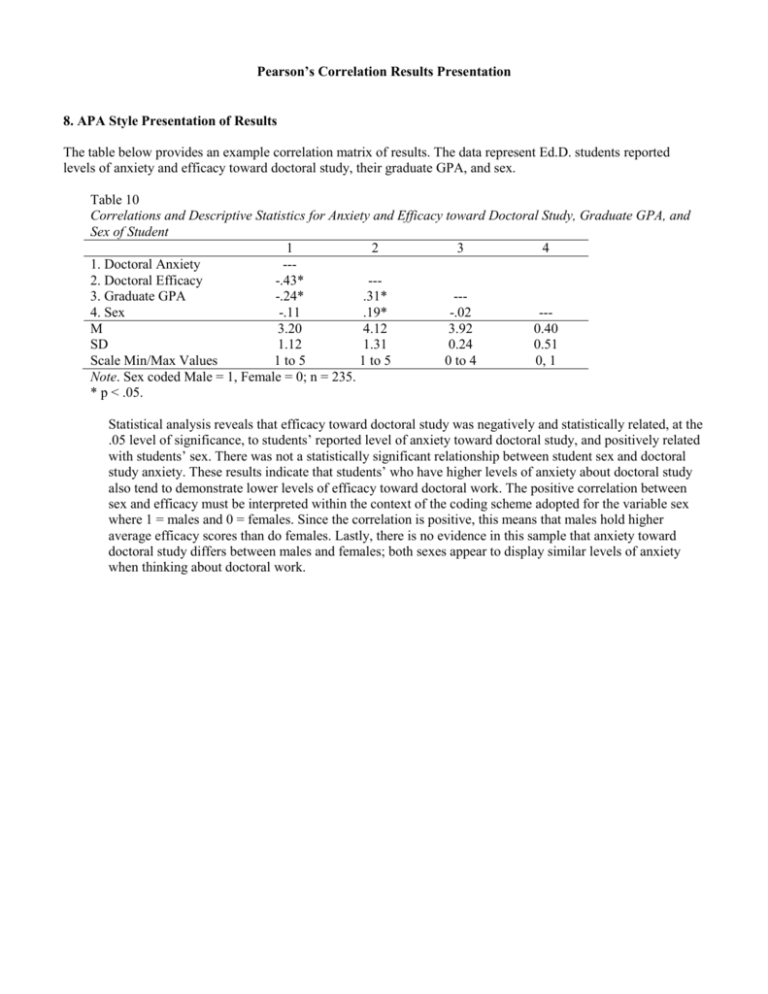
The table below provides an example correlation matrix of results. The data represent Ed.D. students reported
levels of anxiety and efficacy toward doctoral study, their graduate GPA, and sex.
Table 10
Correlations and Descriptive Statistics for Anxiety and Efficacy toward Doctoral Study, Graduate GPA, and
Sex of Student
1
2
3
4
1. Doctoral Anxiety
--2. Doctoral Efficacy
-.43*
--3. Graduate GPA
-.24*
.31*
--4. Sex
-.11
.19*
-.02
--M
3.20
4.12
3.92
0.40
SD
1.12
1.31
0.24
0.51
Scale Min/Max Values
1 to 5
1 to 5
0 to 4
0, 1
Note. Sex coded Male = 1, Female = 0; n = 235.
* p < .05.
Statistical analysis reveals that efficacy toward doctoral study was negatively and statistically related, at the
.05 level of significance, to students’ reported level of anxiety toward doctoral study, and positively related
with students’ sex. There was not a statistically significant relationship between student sex and doctoral
study anxiety. These results indicate that students’ who have higher levels of anxiety about doctoral study
also tend to demonstrate lower levels of efficacy toward doctoral work. The positive correlation between
sex and efficacy must be interpreted within the context of the coding scheme adopted for the variable sex
where 1 = males and 0 = females. Since the correlation is positive, this means that males hold higher
average efficacy scores than do females. Lastly, there is no evidence in this sample that anxiety toward
doctoral study differs between males and females; both sexes appear to display similar levels of anxiety
when thinking about doctoral work.


