jbi12320-sup-0002-AppendixS2
advertisement
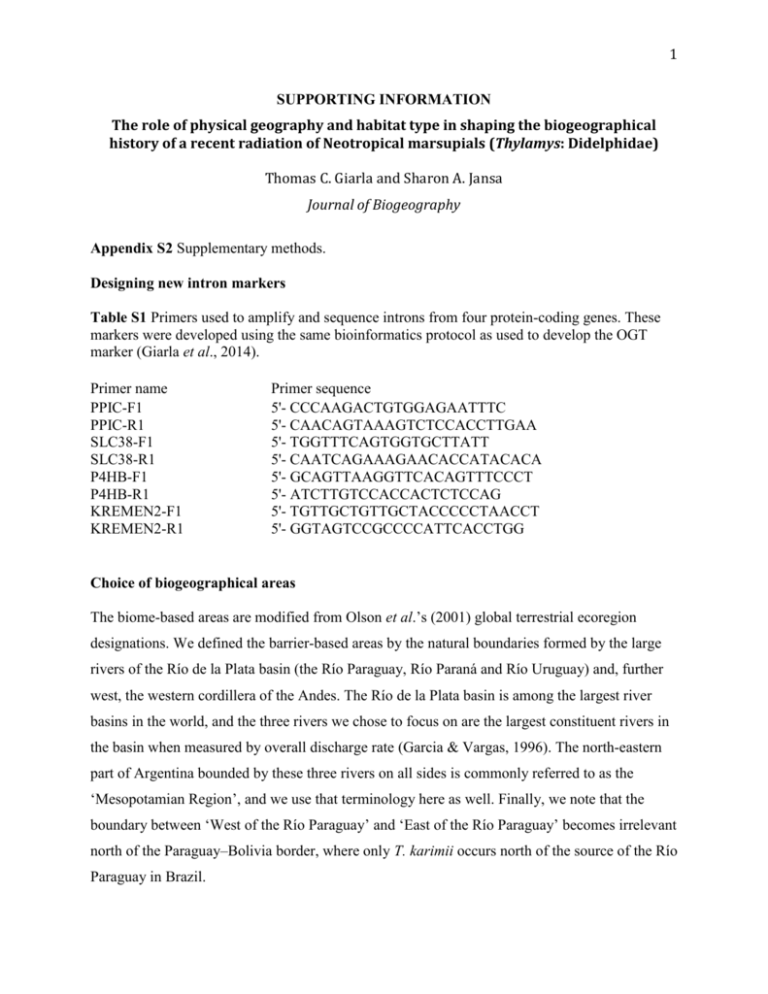
1 SUPPORTING INFORMATION The role of physical geography and habitat type in shaping the biogeographical history of a recent radiation of Neotropical marsupials (Thylamys: Didelphidae) Thomas C. Giarla and Sharon A. Jansa Journal of Biogeography Appendix S2 Supplementary methods. Designing new intron markers Table S1 Primers used to amplify and sequence introns from four protein-coding genes. These markers were developed using the same bioinformatics protocol as used to develop the OGT marker (Giarla et al., 2014). Primer name PPIC-F1 PPIC-R1 SLC38-F1 SLC38-R1 P4HB-F1 P4HB-R1 KREMEN2-F1 KREMEN2-R1 Primer sequence 5'- CCCAAGACTGTGGAGAATTTC 5'- CAACAGTAAAGTCTCCACCTTGAA 5'- TGGTTTCAGTGGTGCTTATT 5'- CAATCAGAAAGAACACCATACACA 5'- GCAGTTAAGGTTCACAGTTTCCCT 5'- ATCTTGTCCACCACTCTCCAG 5'- TGTTGCTGTTGCTACCCCCTAACCT 5'- GGTAGTCCGCCCCATTCACCTGG Choice of biogeographical areas The biome-based areas are modified from Olson et al.’s (2001) global terrestrial ecoregion designations. We defined the barrier-based areas by the natural boundaries formed by the large rivers of the Río de la Plata basin (the Río Paraguay, Río Paraná and Río Uruguay) and, further west, the western cordillera of the Andes. The Río de la Plata basin is among the largest river basins in the world, and the three rivers we chose to focus on are the largest constituent rivers in the basin when measured by overall discharge rate (Garcia & Vargas, 1996). The north-eastern part of Argentina bounded by these three rivers on all sides is commonly referred to as the ‘Mesopotamian Region’, and we use that terminology here as well. Finally, we note that the boundary between ‘West of the Río Paraguay’ and ‘East of the Río Paraguay’ becomes irrelevant north of the Paraguay–Bolivia border, where only T. karimii occurs north of the source of the Río Paraguay in Brazil. 2 Determining area assignments for Thylamys taxa The geographical range of each taxon included in this study (including morphologically cryptic haplogroups within the named species T. pallidior, T. pusillus, T. sponsorius, and T. venustus) was based on georeferenced Thylamys and Lestodelphys collecting localities recorded in recent taxonomic and phylogenetic studies (Fig. S2.1; Braun et al., 2005; Carmignotto & Monfort, 2006; Teta et al., 2009; Giarla et al., 2010; Formoso et al., 2011). In order to assign previously sequenced individuals to intraspecific haplogroups defined by Giarla et al. (2010), all CYTB sequences from Braun et al. (2005) and Teta et al. (2009) were downloaded from GenBank and combined in a single dataset with CYTB sequences from Giarla et al. (2010) for phylogenetic analysis. This dataset of 181 sequences [including five outgroup sequences from Giarla et al. (2010)] was analysed in a Bayesian framework using MRBAYES 3.2 (Ronquist et al., 2012). The GTR+I+ nucleotide substitution model fit the data best according to JMODELTEST 2.1.3 (Darriba et al., 2012), and this model was specified for the full CYTB dataset in MRBAYES for a single Markov chain Monte Carlo (MCMC) run of 20 million generations with four Metropoliscoupled chains. Previously unassigned sequences from Braun et al. (2005) and Teta et al. (2009) clustered unambiguously with the haplogroups defined in Giarla et al. (2010) and were assigned accordingly (Fig. S2.2). Once all sequences were assigned to species or haplogroups, the georeferenced localities were added to the range map (Fig. S2.1). Several taxa discussed in Giarla et al. (2010) are based on specimen records from a limited portion of the suspected total range of the haplogroup (e.g. Thylamys pusillus A, B, and C). In order to expand the number of localities for these poorly sampled haplogroups, unsequenced material from Teta et al. (2009) and Formoso et al. (2011) was considered. Teta et al. include locality records of specimens from several taxa considered synonyms of T. pusillus by Giarla et al.: T. citellus, T. bruchi, and T. pulchellus. As discussed in Giarla et al. (2010), T. citellus corresponds to T. pusillus C and both T. bruchi and T. pulchellus correspond to T. pusillus B. Specimens referred to simply as ‘T. pusillus’ by Teta et al. correspond to T. pusillus A as defined by Giarla et al. (2010). Although the assignment of these specimens to particular haplogroups would best be accomplished by phylogenetic analysis of DNA sequences, the geographical distributions of unsequenced specimens concord with sequenced specimens and most occur within a single defined area (e.g. tropical savannah). ‘Thylamys pusillus’ localities 3 from Teta et al. all occur north of the Río Bermejo and west of the Río Paraguay, in the same region as the sequenced specimens assigned to T. pusillus A by Giarla et al. Teta et al.’s T. bruchi and T. pulchellus locales are all recorded in central Argentina south of the Río Bermejo and west of the Río Paraguay, the same broad area inhabited by Giarla et al.’s T. pusillus B. Finally, Teta et al.’s T. citellus localities all occur between the Ríos Paraná and Uruguay in north-eastern Argentina, the same isolated area as the sequenced specimens assigned to T. pusillus C by Giarla et al. Given these distributions, we assigned Teta et al.’s unsequenced material to the corresponding Giarla et al. haplogroup and add the georeferenced localities to the range map (Fig. S2.1). Although Giarla et al. (2010) sequenced a broadly distributed sample of 30 T. pallidior individuals, the southern and eastern extent of T. pallidior haplogroup B’s range was not robustly sampled. As such, all T. pallidior localities from Formoso et al. (2011) were assigned to haplogroup B based on their geographical distribution in the far south of T. pallidior B’s range. We assign Formoso et al.’s T. pallidior samples to T. pallidior B because these individuals could not plausibly be assigned to the more northerly haplogroup A. Finally, we also included all records of Lestodelphys halli reported in Formoso et al. (2011) to bolster our sample size for that taxon. Verification and modification of biogeographical area maps Satellite imagery from Google Earth was used to verify and refine ecoregion assignments for localities near ecoregion boundaries and in regions where Olson et al.’s (2001) line maps were not sufficiently precise (Särkinen et al., 2011). Biome assignments for Thylamys pallidior B were revised based on satellite imagery. Six T. pallidior B collecting locales occur within the boundaries of Olson et al.’s ‘Tropical and Subtropical Savannah, Grassland, and Shrubland’ biome. Upon closer inspection, each record can be found to occur on isolated mountain ridges within the Sierras de Córdoba in San Luis and Córdoba provinces. Satellite imagery from these localities show that these isolated montane habitats are quite distinct from the surrounding lowlands and would be more appropriately classified in montane or temperate biomes. As such, T. pallidior is not assigned to the Tropical Savannah biome. We did not follow Olson et al. (2001) and distinguish between montane elements of moist broadleaf forests and tropical dry forests in southern Bolivia and northern Argentina 4 (Yungas forests). These two forest types distinguished by Olson et al. are contiguous, more similar to each other than to any other adjacent biomes (e.g. montane grasslands and lowland savannah), and so different from the other more open habitats that Thylamys inhabits that we join them into the general category of ‘Montane Forest’. In addition, we did not consider Olson et al.’s Atlantic forest and flooded grasslands ecoregions in our analysis, because Thylamys species that are purported to inhabit these areas based on collecting localities all occur near the boundaries of included biomes and likely represent marginal populations. REFERENCES Braun, J.K., Van Den Bussche, R.A., Morton, P.K. & Mares, M.A. (2005) Phylogenetic and biogeographic relationships of mouse opossums Thylamys (Didelphimorphia, Didelphidae) in southern South America. Journal of Mammalogy, 86, 147–159. Carmignotto, A.P. & Monfort, T. (2006) Taxonomy and distribution of the Brazilian species of Thylamys (Didelphimorphia: Didelphidae). Mammalia, 70, 126–144. Darriba, D., Taboada, G.L., Doallo, R. & Posada, D. (2012) jModelTest 2: more models, new heuristics and parallel computing. Nature Methods, 9, 772. Formoso, A.E., Sauthier, D.E.U., Teta, P. & Pardiñas, U.F.J. (2011) Dense-sampling reveals a complex distributional pattern between the southernmost marsupials Lestodelphys and Thylamys in Patagonia, Argentina. Mammalia, 75, 371–379. Garcia, N.O. & Vargas, W.M. (1996) The spatial variability of runoff and precipitation in the Río de la Plata basin. Hydrological Sciences Journal, 41, 279–299. Giarla, T.C., Voss, R.S. & Jansa, S.A. (2010) Species limits and phylogenetic relationships in the didelphid marsupial genus Thylamys based on mitochondrial DNA sequences and morphology. Bulletin of the American Museum of Natural History, 346, 1–67. Giarla, T.C., Voss, R.S. & Jansa, S.A. (2014) Hidden diversity in the Andes: comparison of species delimitation methods in montane marsupials. Molecular Phylogenetics and 5 Evolution, 70, 137-151. Olson, D.M., Dinerstein, E., Wikramanayake, E.D., Burgess, N.D., Powell, G.V.N., Underwood, E.C., D'Amico, J.A., Itoua, I., Strand H .E., Morrison, J.C., Loucks, C.J., Allnutt, T.F., Ricketts, T.H., Kura, Y., Lamoreux, J.F., Wettengel, W.W., Hedao, P. & Kassem, K.R. (2001) Terrestrial ecoregions of the world: a new map of life on Earth. BioScience, 51, 933– 938. Ronquist, F., Teslenko, M., van der Mark, P., Ayres, D.L., Darling, A., Hohna, S., Larget, B., Liu, L., Suchard, M.A. & Huelsenbeck, J.P. (2012) MrBayes 3.2: efficient Bayesian phylogenetic inference and model choice across a large model space. Systematic Biology, 61, 539–542. Särkinen, T., Pennington, R.T., Lavin, M., Simon, M.F. & Hughes, C.E. (2011) Evolutionary islands in the Andes: persistence and isolation explain high endemism in Andean dry tropical forests. Journal of Biogeography, 39, 884–900. Teta, P., D'Elía, G., Flores, D.A. & de La Sancha, N. (2009) Diversity and distribution of the mouse opossums of the genus Thylamys (Didelphimorphia, Didelphidae) in north-eastern and central Argentina. Gayana, 73, 180–199. 6 Figure S2.1 Terrestrial biomes of central and southern South America from Olson et al. (2001), with Thylamys and Lestodelphys collecting localities. Each species receives its own symbol colour, with different shades of that colour and symbols (circle, square, diamond) defining intraspecific haplogroups. -75 -70 -65 -60 -55 -50 -45 -40 -10 -15 -20 P ilc om ayo Riv Berm er ejo Ri ve r Paragu ay R i -25 v gu a ru r ive U ar a n á Rive r er -30 yR P Lestodelphys macrurus velutinus tatei karimii sp. pusillus A elegans pusillus B* pallidior A pusillus C** pallidior B venustus A sponsorius A venustus B sponsorius B venustus C -35 *Includes “bruchi” and “pulchellus” **Includes “citellus” Montane Grasslands and Shrublands Includes High Monte, Puna, and Andean Steppe Temperate Grasslands, Savannas, and Shrublands Includes Patagonian Steppe, Low Monte, Espinal, and Pampas -40 Tropical and Subtropical Grasslands, Savannas, and Shrublands Includes Uruguayan Savanna, Chaco, Beni Savanna, and Cerrado Flooded Grasslands and Savannas Includes Paraná Flooded Savanna, Mesopotamian Savanna, and Pantanal Deserts and Xeric Shrublands Include Atacama Desert, Sechura Desert, and Caatinga Tropical and Subtropical Moist Broadleaf Forests -45 Includes Yungas Forest, Amazonian Forest, and Atlantic Forest Tropical and Subtropical Dry Broadleaf Forests Includes Montane Dry Forest, Chiquitano Dry Forest, ad Atlantic Dry Forest Temperate Broadleaf and Mixed Forests Includes Valdivian Temperate Forest and Magellanic Subpolar Forests Mediterranean Forests, Woodlands, and Scrub Includes Chilean Matorral 7 Figure S2.2. Phylogenetic tree of Thylamys and Lestodelphys based on Bayesian analysis of CYTB sequences gathered from GenBank. Filled circles () represent sequences generated by Braun et al. (2005) and Teta et al. (2009). Only posterior probabilities at key nodes are shown. Tips on the tree are labelled with a taxon identifier, voucher number, and GenBank number. Scale bar units are in substitutions per site.

