Chemistry Revision Notes
advertisement
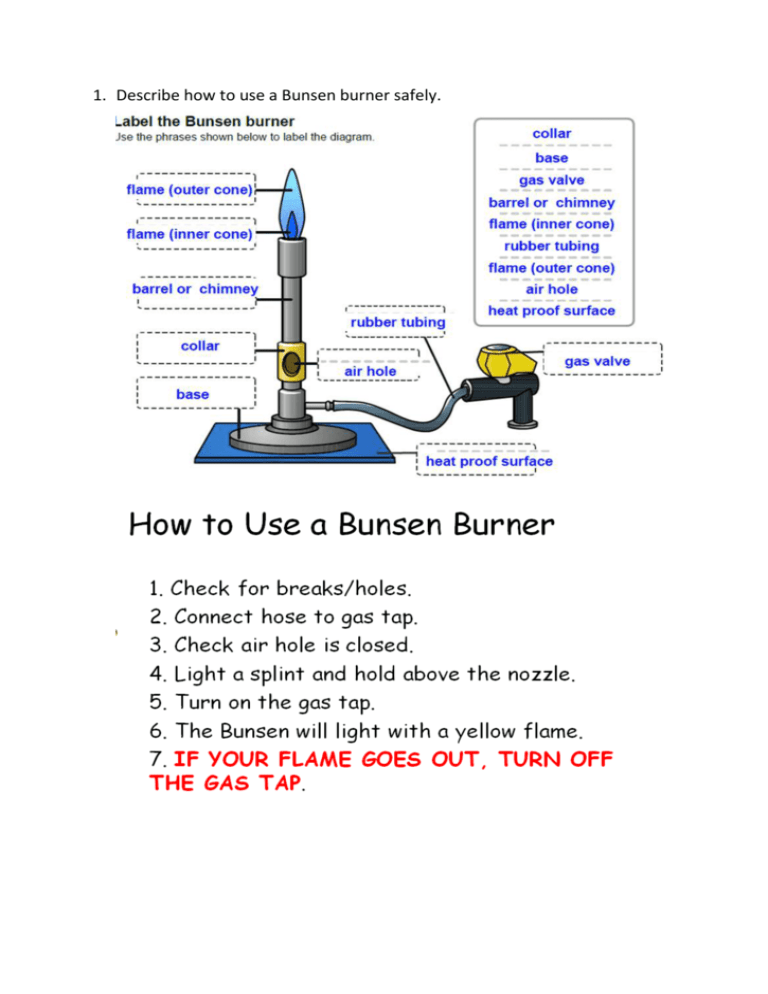
1. Describe how to use a Bunsen burner safely. 2. Recall the evidence of a chemical reaction. Colour change Gas formation Energy given off (heat or light) 3. Explain the law of conservation of mass. Matter cannot be created or destroyed in a chemical reaction. Mass of Reactants (starting materials) = Mass or Products 4. Describe in terms of atoms what happens in a chemical reaction. During a chemical reaction the atoms are rearranged. 5. Give examples of chemical and physical changes. Chemical Change = change where a new substance is formed Examples: Combustion (burning), Neutralisation, Rusting Physical Change = change where the substances stays the same Examples: Mixing, Dissolving, Melting, Freezing 6. Describe what happens when metals react with acids. When metals react with acid hydrogen gas and a salt are formed. 7. Describe the test for hydrogen. Collect the gas. Use a lit splint to ignite the gas. If the gas burns with a squeaky pop the gas is hydrogen. 8. Describe what happens when carbonates react with acids. When carbonates react with acids carbon dioxide gas, water, and a salt are formed. 9. Describe the test for carbon dioxide. Bubble the gas through limewater. If the limewater turns milky/cloudy the gas is carbon dioxide. 10.Explain what is needed for a combustion reaction (fire triangle). Combustion is the scientific name for the chemical reaction when substances burn. Fire triangle: fuel, heat, and oxygen 11.Describe what a fuel is and what they are used for. Fuels are chemical that store energy that can be released as heat and light energy through combustion. Fuels are used to generate electricity in power stations, used for heating, and used for transportation (petrol for cars). 12. Extenstion: Write a word equation for metal + acid, metal + carbonates, and combustion reactions. Metal + Acid Salt + Hydrogen Metal Carbonate + Acid Salt + Carbon Dioxide + Water 13.Draw a graph. Line graphs are for continuous variables (numbers). Title Appropriate scale (try to fit graph to whole space) Labelled YAxis with Units (Dependent Variable, we measure) Line/Curve of Best Fit Labelled X-Axis with Units (Independent Variable, we change) Bar Graphs are for categorical variables (for categories without numbers). Appropriate scale (try to fit graph to whole space) Leave a space between bars Labelled Y-Axis with Units (Dependent Variable, we measure) Labelled X-Axis with Categories (Independent Variable, we change)
