Becoming an Expert AA
advertisement
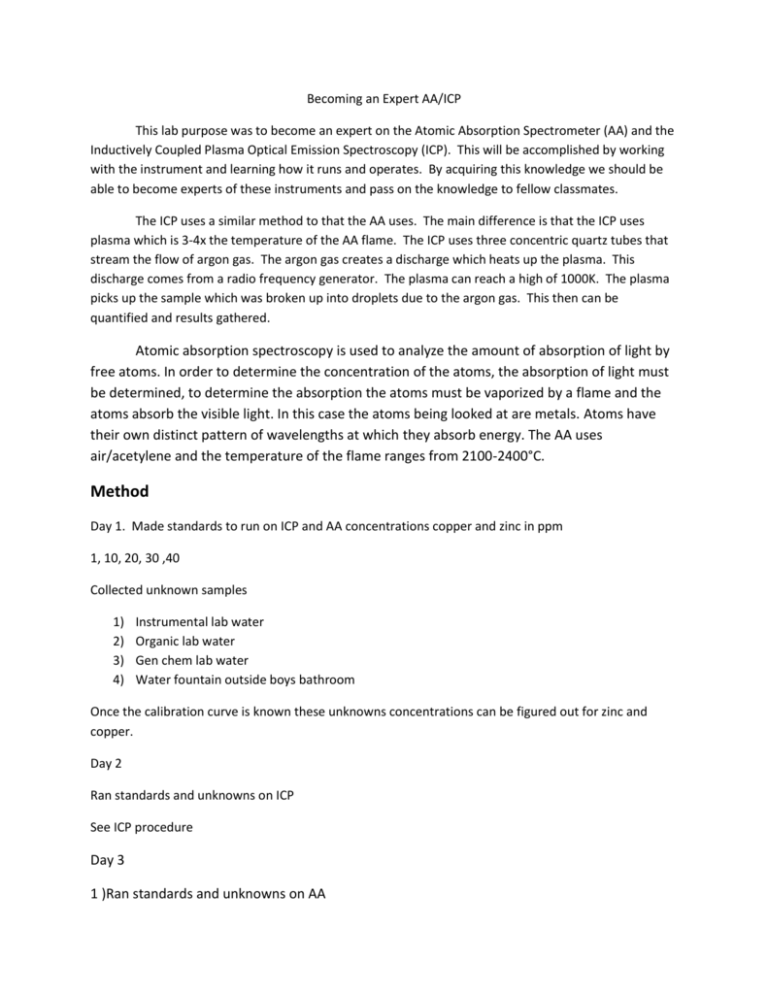
Becoming an Expert AA/ICP This lab purpose was to become an expert on the Atomic Absorption Spectrometer (AA) and the Inductively Coupled Plasma Optical Emission Spectroscopy (ICP). This will be accomplished by working with the instrument and learning how it runs and operates. By acquiring this knowledge we should be able to become experts of these instruments and pass on the knowledge to fellow classmates. The ICP uses a similar method to that the AA uses. The main difference is that the ICP uses plasma which is 3-4x the temperature of the AA flame. The ICP uses three concentric quartz tubes that stream the flow of argon gas. The argon gas creates a discharge which heats up the plasma. This discharge comes from a radio frequency generator. The plasma can reach a high of 1000K. The plasma picks up the sample which was broken up into droplets due to the argon gas. This then can be quantified and results gathered. Atomic absorption spectroscopy is used to analyze the amount of absorption of light by free atoms. In order to determine the concentration of the atoms, the absorption of light must be determined, to determine the absorption the atoms must be vaporized by a flame and the atoms absorb the visible light. In this case the atoms being looked at are metals. Atoms have their own distinct pattern of wavelengths at which they absorb energy. The AA uses air/acetylene and the temperature of the flame ranges from 2100-2400°C. Method Day 1. Made standards to run on ICP and AA concentrations copper and zinc in ppm 1, 10, 20, 30 ,40 Collected unknown samples 1) 2) 3) 4) Instrumental lab water Organic lab water Gen chem lab water Water fountain outside boys bathroom Once the calibration curve is known these unknowns concentrations can be figured out for zinc and copper. Day 2 Ran standards and unknowns on ICP See ICP procedure Day 3 1 )Ran standards and unknowns on AA 2) Remade concentrations for ICP 1) 5ppm, 8ppm, 10ppm, 13ppm, 15ppm. 2) Made concentrations in a 100mL volumetric flask than transferred to a beaker to run experiments. Day 4 Ran new standards on ICP and unknowns ICP Procedure 1) Turning on the ICP a. The cooling unit should be on for ten minutes; this is left of the ICP and is a box. To turn it on the switch is on the back of the cooling unit run for 15 minutes. i. Make sure the unit has cooling liquid in it. b. Flip the levers on the bottom right of the ICP and make sure that the tubes attached to them do not twist. Otherwise the flow will be changed. c. Turn on the argon gas for around 5-10 minutes. This is accomplished by turning the dial on the argon tank in the gas cylinder room. The dial is on top of the tank and is to be turned counter clockwise. Also turn the valve so that it is perpendicular to the tubing (located behind tank). On the left of the instrument table there is a valve labeled argon gas turn that so it is also parallel with the tubing. d. Finally turn on the ICP. You should have a blank in the probe so that the bulb does not burn out. This should be done at all times you’re not running a sample. 2) Software startup a. Turn on the computer and click on ICP expert. b. Click on the button that resembles a lock with electricity in the middle of the top page, this will turn on the plasma. If you can’t find it there are pictures of the icon in the ICP log book in the drawer. This should be heated for 15 minutes. 3) Method a. On the main index window select worksheet. b. On the load dialog worksheet box select new. You will then have a choice for either quantitative or time resolved scan, this experiment uses quantitative. Save the worksheet c. Open the method editor; this is done by clicking on the box with the hand that seems to be writing on paper. This should open the elements page. d. To select the elements you will be looking for (zinc and copper) hold control and click on the elements. They will then be highlighted blue e. Click on the standards tab and edit the number of calibration standards. In the experiment 5 are being used. Select the units of measurement you will be using. Keep the correlation coefficient the same. Save and exit from file menu 4) Analysis a. Once the flame has been on for 10 -15 minutes click on the sequence tab under the worksheet window and make sure the source is set to manual. b. Click the icon that looks like a wand and a magic hat; this is the sequence editor icon. Enter the number of samples in the sample field count, on the samples and calibration page. Click on begin with calibrations and select include a blank, then click confirm. c. On the sequence page, select the sequence parameters icon, and choose stop for the calibration failure option. Click okay to exit and yes to confirm selections. d. Click the analysis tab and confirm all samples are selected, if not click the tube cell in top left corner. e. Click on play icon and follow instructions. If an error message pops up that says “maximum error exceeded”, just click okay and run your samples f. After your data is collected place a blank into probe. g. On data chart, click on the diagonal line to get calibration graph. Print if you want and print the data. 5) Turning off ICP a. To turn off the plasmid press the lock with the electricity button or the F4 key b. Turn off computer program c. Turn off argon gas at bench top and in the gas cylinder room. Turn clockwise and valve on wall and bench top should perpendicular. d. Turn off ICP e. After 15 minutes turn off coolant and take out blank. AA Standard Operating Procedure: 1. Turning of the AA a. Make sure the exhaust fan is turned on (it should always be on) b. Then turn on the AA cooling system, which is to left of the AA c. Then turn on the AA, the power button is on the front left of the machine d. Then go to the gas room and turn on the air and the acetylene e. Open the gas valves for air and the acetylene on the left of the AA f. Make sure the lamps for the specific elements you are looking for are installed (zinc and copper were already) 2. Open the WinLab 32 software on the desktop of the computer a. System check will appear for the flame, spectrometer, and the auto sampler b. Then click the Lamps button at the top left of the screen. A window will open and turn on the element you are searching for clicking on the on/off button and then highlight the row of the element. When the light is green, the lamp is turned on. Wait ten minutes for the lamp to warm up fully and when it is finished close the window. 3. Create a Method a. Click the “Wrkspc” button in the menu bar at the top. When a window pops up, click the “AUTO.flm” or “MAN.flm”. Four new windows will then appear on the screen. b. Then click the “File” menu button and click “New” and the “Method”. Then select the element you are going to be running for this experiment and click the checkbox for “Recommended Values”. c. A “Method Editor Window” will then appear. Click the “Spectrometer” tab, and make sure the appropriate element is chosen. Do not change any of the other settings. d. Click the “Calibration” tab. Click the “Equations and Units” tab on the side of the window. Select the equation of the line you want to use for your experiment (We used linear through zero). Enter the concentrations (ppm) for your samples and standards. Click the “Standard Concentrations” tab on the side of the window. Enter the names of your standards and samples and the concentrations of your standards in the appropriate places (Do not fill in the A/S column; it will be filled in by the computer with your results). Close the window 4. Turning on the flame a. Check to make sure the flame is safe to light by looking at the “Safety Interlocks” box. Green check means it is safe and a red x means it is not safe and will not light. b. Once it is safe to light, click the ignite flame button and the top middle of the screen. (If it does not light, try again and if it continues to not work, check the gases being used) 5. Run Standards and Samples a. Look at the “Manual Analysis Control” screen b. Place the tube in your blank (distilled water) and click “Analyze Blank”. (When the green light goes out the sample is done being analyzed) c. After the blank then run your standards the same way but in the Standard part of the “Manual Analysis Control” screen d. After the standards then your samples the same way but in the Sample part of the “Manual Analysis Control” screen 6. AA Shut-down a. Flush the probe with deionized water b. Turn off the flame c. Turn off the lamp d. Close the air and acetylene valves at the bench next to the AA e. Turn off the air and the acetylene in the gas storage room f. Bleed the gases by clicking on the “Bleed Gases” button in the “Flame Control Panel” g. Close the software entirely h. Turn off the AA i. Turn off the AA cooling system Data Measurements for copper and zinc to make dilutions (ppm) For ICP 1000𝑝𝑝𝑚𝑉 = 5𝑝𝑝𝑚(100𝑚𝑙) 𝑉 = .5𝑚𝑙 1000𝑝𝑝𝑚𝑉 = 8𝑝𝑝𝑚(100𝑚𝐿) 𝑉 = .8𝑚𝐿 1000𝑝𝑝𝑚𝑉 = 10𝑝𝑝𝑚(100𝑚𝐿) 𝑉 = 1𝑚𝐿 1000𝑝𝑝𝑚𝑉 = 13𝑝𝑝𝑚(100𝑚𝐿) 𝑉 = 1.3𝑚𝐿 1000𝑝𝑝𝑚𝑉 = 15𝑝𝑝𝑚(100𝑚𝐿) 𝑉 = 1.5𝑚𝐿 For AA 1000𝑝𝑝𝑚𝑉 = 5𝑝𝑝𝑚(100𝑚𝑙) 𝑉 = .5𝑚𝑙 1000𝑝𝑝𝑚𝑉 = 10𝑝𝑝𝑚(100𝑚𝐿) 𝑉 = 1𝑚𝐿 1000𝑝𝑝𝑚𝑉 = 20𝑝𝑝𝑚(100𝑚𝐿) 𝑉 = 2𝑚𝐿 1000𝑝𝑝𝑚𝑉 = 30𝑝𝑝𝑚(100𝑚𝐿) 𝑉 = 3𝑚𝐿 1000𝑝𝑝𝑚𝑉 = 40𝑝𝑝𝑚(100𝑚𝐿) 𝑉 = 4𝑚𝐿 Data Results for ICP Sample Cu conc. (ppm) Standard 1 Standard 2 Standard 3 Standard 4 Standard 5 Instrumental tap water Organic Lab water Gen Chem lab water Water fountain Zn conc. (ppm) 5 8 10 13 15 X Cu intensity (c/s) 18652 32971 74762 83727 100966 67.64 5 8 10 13 15 X Zn intensity (C/s) 43367 56595 87164 129375 151985 104.08 X 707.42 X 5724.8 X 905.34 X 202.5 X 412.62 X 255.02 Graph ICP Results Zn intensity (c/s) y=11534x-23948 r2=.9689 Intensity (c/s) 200000 150000 Cu intenstiy (c/s) y=8513x-24613 100000 r2=.9335 50000 0 0 5 10 15 Concentration (ppm) Cu concentrations for unknown Instrumental – 67.64 = 8513𝑥 − 24613 𝑋 = 2.934 𝑝𝑝𝑚 Organic707.42 = 8513𝑥 − 24613 𝑥 = 2.974𝑝𝑝𝑚 Gen Chem90.534 = 8513𝑥 − 24613 2.90𝑝𝑝𝑚 Water fountain- 20 412.62 = 8313𝑥 − 24613 𝑥 = 3.01𝑝𝑝𝑚 Zn concentrations for unknown Instrumental104.08 = 11534𝑥 − 23948 2.09𝑝𝑝𝑚 Organic5724.8 = 11534𝑥 − 23948 2.57𝑝𝑝𝑚 Gen Chem202.5 = 11534𝑥 − 23948 2.09𝑝𝑝𝑚 Water fountain255.02 = 11534𝑥 − 23948 2.010𝑝𝑝𝑚 AA data table resultsSample Cu conc. (ppm) Standard 1 5 Standard 2 10 Standard 3 20 Standard 4 30 Standard 5 40 Instrumental X Organic X Gen Chem X Water fountain x Cu signal (Abs) .2018 .3923 .7194 1.0091 1.249 .3477 .346 .3458 .3458 Zn conc. (ppm) 5 10 20 30 40 N/a N/a N/a N/a Zn signal (Abs) N/a N/a N/a N/a N/a N/a N/a N/a N/a Copper graph AA result Abs (Cu) 1.5 1.0 0.5 0.0 0 10 20 30 40 50 Concentration (ppm) Equation of line y=.00268x+.3457 R2= .6761 Unknown water concentrations for Cu Instrumental – . 3457 = .00268x + .3457 𝑥 = .014𝑝𝑝𝑚 Organic. 346 = .00268x + .3457 𝑥 = .167𝑝𝑝𝑚 Gen Chem. 3458 = .00268x + .3457 𝑥 = .032𝑝𝑝𝑚 Water fountain. 3458 = .00268x + .3457 𝑥 = .033𝑝𝑝𝑚 ZnWe’re not able to get a reading from the zinc standards we made. If we were to run it again smaller standards would be used to get better results. DiscussionThe ICP worked well and we were able to get decent results. However we had no luck with the AA. Are copper results are terrible and we had no results from the zinc. If we had more time we would of ran the new standards we made for the ICP on the AA. Hopefully this would fix the calibration curve we had.

