Hw07-Gray
advertisement
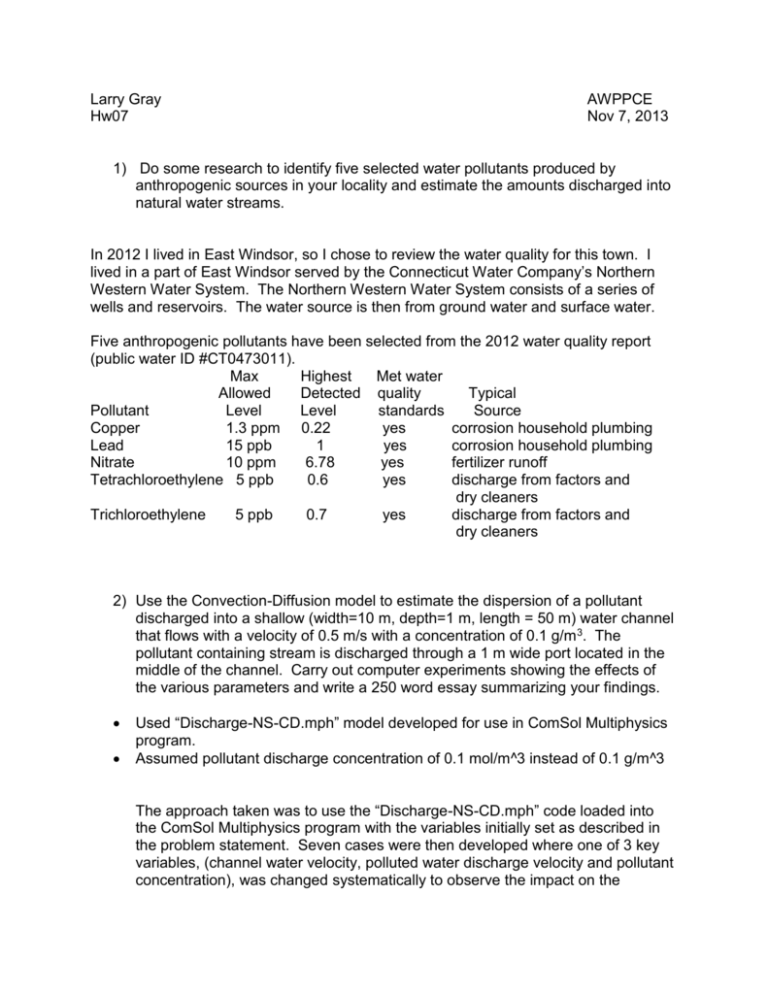
Larry Gray Hw07 AWPPCE Nov 7, 2013 1) Do some research to identify five selected water pollutants produced by anthropogenic sources in your locality and estimate the amounts discharged into natural water streams. In 2012 I lived in East Windsor, so I chose to review the water quality for this town. I lived in a part of East Windsor served by the Connecticut Water Company’s Northern Western Water System. The Northern Western Water System consists of a series of wells and reservoirs. The water source is then from ground water and surface water. Five anthropogenic pollutants have been selected from the 2012 water quality report (public water ID #CT0473011). Max Highest Met water Allowed Detected quality Typical Pollutant Level Level standards Source Copper 1.3 ppm 0.22 yes corrosion household plumbing Lead 15 ppb 1 yes corrosion household plumbing Nitrate 10 ppm 6.78 yes fertilizer runoff Tetrachloroethylene 5 ppb 0.6 yes discharge from factors and dry cleaners Trichloroethylene 5 ppb 0.7 yes discharge from factors and dry cleaners 2) Use the Convection-Diffusion model to estimate the dispersion of a pollutant discharged into a shallow (width=10 m, depth=1 m, length = 50 m) water channel that flows with a velocity of 0.5 m/s with a concentration of 0.1 g/m 3. The pollutant containing stream is discharged through a 1 m wide port located in the middle of the channel. Carry out computer experiments showing the effects of the various parameters and write a 250 word essay summarizing your findings. Used “Discharge-NS-CD.mph” model developed for use in ComSol Multiphysics program. Assumed pollutant discharge concentration of 0.1 mol/m^3 instead of 0.1 g/m^3 The approach taken was to use the “Discharge-NS-CD.mph” code loaded into the ComSol Multiphysics program with the variables initially set as described in the problem statement. Seven cases were then developed where one of 3 key variables, (channel water velocity, polluted water discharge velocity and pollutant concentration), was changed systematically to observe the impact on the dispersion modeling. The concentration of pollutant in the channel was recorded at a distance 10 m downstream of the discharge pipe. There are also graphical results presented on individual worksheet pages, Case 1 through Case 7, in the companion excel file “Hw07-P2_Gray.xls”. For each case, four graphs are presented: arrow surface chart which illustrates the velocity field streamlines, a contour chart showing the pollutant concentration in the channel, a chart showing the pressure contours and finally a surface plot showing the magnitude of the velocity as a function of location in the channel. The summary table shows that, without stating the obvious, that faster moving water tends to disperse the pollutant further downstream and dilute the concentration, as observed for cases 1, 2 and 3. A comparison of cases 1, 4 and 5 show that as pollutant concentration in the discharge increases, so does the concentration in the channel water. In observing the graphical results, the dispersion patterns are constant as the channel water velocity was held constant. Only the magnitude of the pollutant concentration increased in line with the assumed discharge concentration. The velocity of the polluted water from the discharge port was increased going from case 1 to case 6. This shows the effect of a velocity component perpendicular to the channel water velocity and changes how the pollutant is dispersed horizontally as well as downstream. Finally, case 7 presents a scenario where both the channel water velocity and pollutant discharge velocity are increased. This shows a larger downstream dispersion effect.


![paper_ed1_1[^]](http://s3.studylib.net/store/data/007776128_2-b65530801ef2800d030f8c15f5438a5e-300x300.png)