Name: Date: ______ Review Sheet The mean of 6 and is the same
advertisement
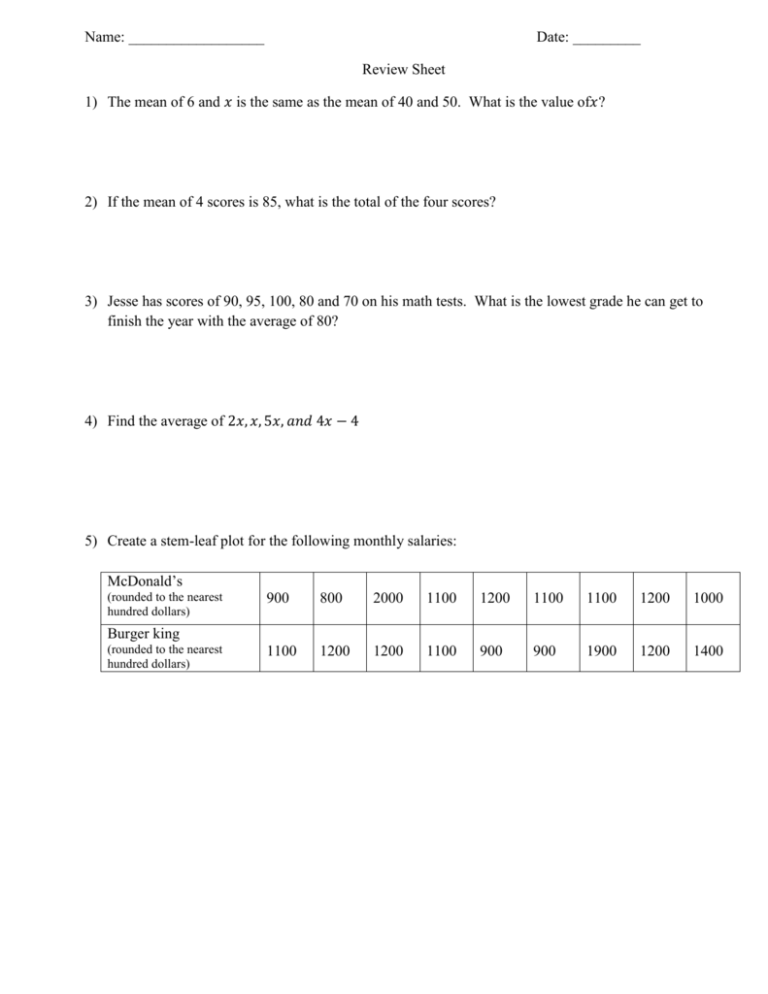
Name: __________________ Date: _________ Review Sheet 1) The mean of 6 and 𝑥 is the same as the mean of 40 and 50. What is the value of𝑥? 2) If the mean of 4 scores is 85, what is the total of the four scores? 3) Jesse has scores of 90, 95, 100, 80 and 70 on his math tests. What is the lowest grade he can get to finish the year with the average of 80? 4) Find the average of 2𝑥, 𝑥, 5𝑥, 𝑎𝑛𝑑 4𝑥 − 4 5) Create a stem-leaf plot for the following monthly salaries: McDonald’s (rounded to the nearest hundred dollars) 900 800 2000 1100 1200 1100 1100 1200 1000 1100 1200 1200 1100 900 900 1900 1200 1400 Burger king (rounded to the nearest hundred dollars) 6) The following is a list of 22 test scores from one of Miss Broukhim’s math class: 80, 83, 90, 83, 30, 75, 70, 74, 75, 75, 81, 60, 58, 82, 84, 50, 86, 68, 75, 61, 50, 85 a) Fill in the table on the right. Interval b) Construct a frequency histogram below. 30 – 39 Tally Frequency Cumulative Frequency c) What is the mean? d) What is the median? e) What is the mode? f) What interval contains the mode? g) What interval is the mode? h) What comments can you make about the test scores? What kind of test was this (easy, fair, or hard)? i) If a student complains about the test, which mathematical information should the student use? How should Miss Broukhim respond?

