87 76
advertisement
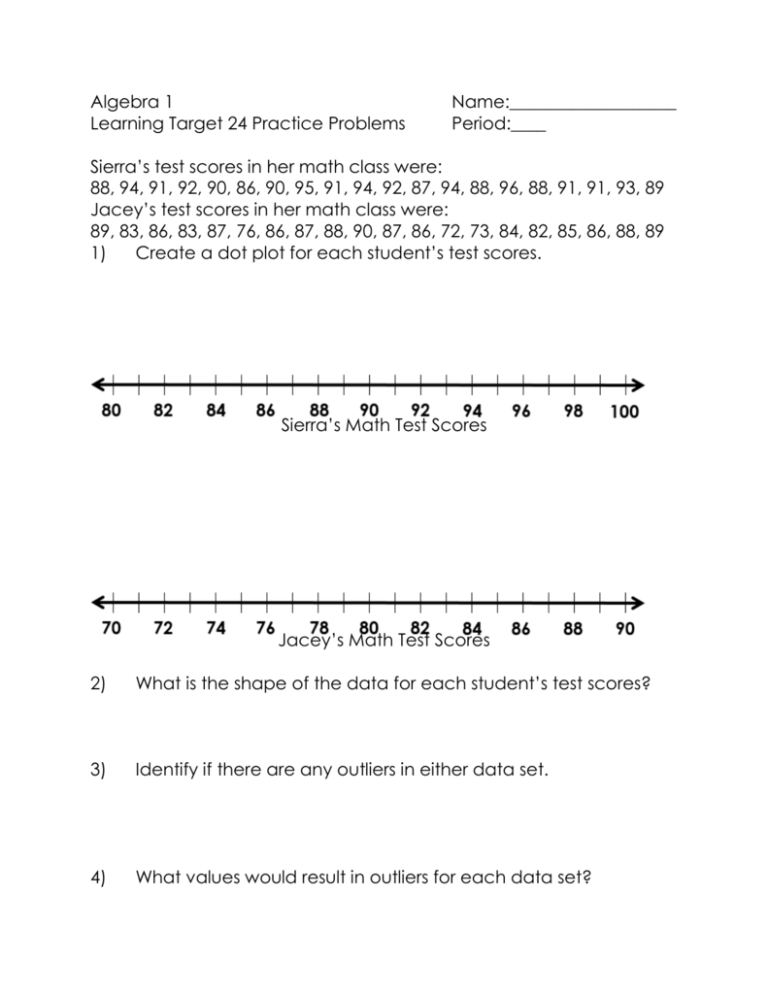
Algebra 1 Learning Target 24 Practice Problems Name:___________________ Period:____ Sierra’s test scores in her math class were: 88, 94, 91, 92, 90, 86, 90, 95, 91, 94, 92, 87, 94, 88, 96, 88, 91, 91, 93, 89 Jacey’s test scores in her math class were: 89, 83, 86, 83, 87, 76, 86, 87, 88, 90, 87, 86, 72, 73, 84, 82, 85, 86, 88, 89 1) Create a dot plot for each student’s test scores. Sierra’s Math Test Scores Jacey’s Math Test Scores 2) What is the shape of the data for each student’s test scores? 3) Identify if there are any outliers in either data set. 4) What values would result in outliers for each data set? 5) The following data represent the highest temperatures for the year in Youngstown, Ohio for the last ten years. Should any of these temperatures be considered outliers? If so, which one(s)? (Be sure to show the math to back up your claim!) 97, 98, 93, 91, 91, 93, 95, 93, 88, 88 6) Kobe Bryant’s average points per game for each of his 17 seasons are listed below. Should any of these averages be considered outliers? If so, which one(s)? (Be sure to show the math to back up your claim!) 7.6, 15,4, 19,9, 22.5, 28.5, 25.2, 30.0, 24.0, 27.6, 35.4, 31.6, 28.3, 26.8, 27.0, 25.3, 27.9, 27.3 What is the shape of the data pictured below? 7) 8)


