Module 14 Project instructions.docx
advertisement

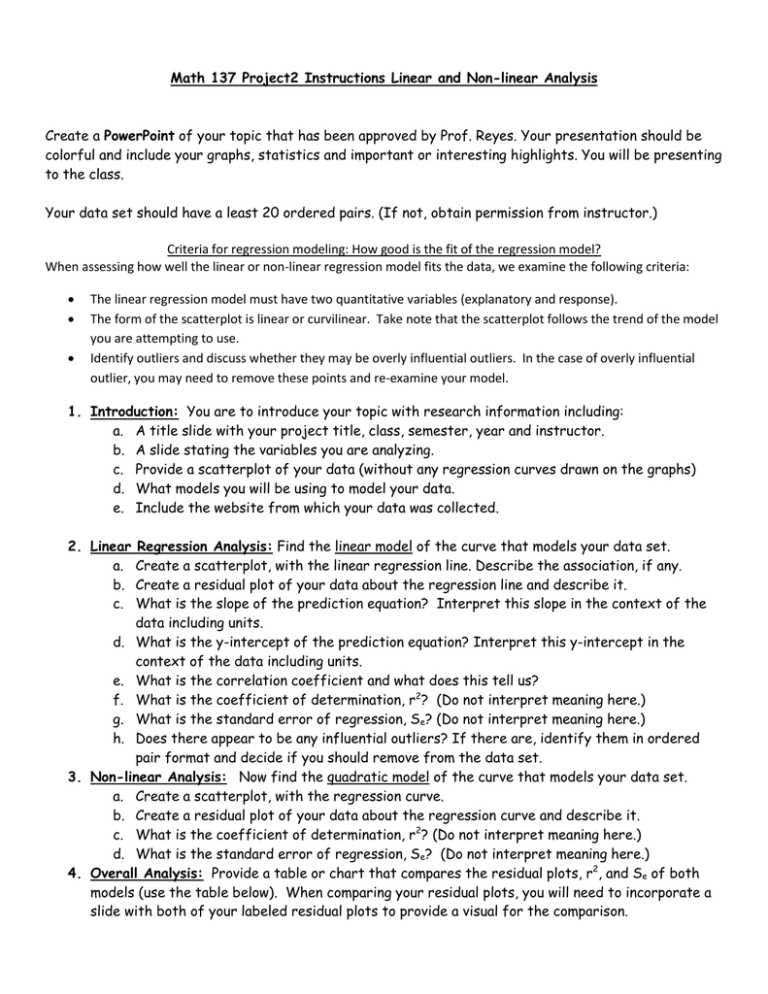
Math 137 Project2 Instructions Linear and Non-linear Analysis Create a PowerPoint of your topic that has been approved by Prof. Reyes. Your presentation should be colorful and include your graphs, statistics and important or interesting highlights. You will be presenting to the class. Your data set should have a least 20 ordered pairs. (If not, obtain permission from instructor.) Criteria for regression modeling: How good is the fit of the regression model? When assessing how well the linear or non-linear regression model fits the data, we examine the following criteria: The linear regression model must have two quantitative variables (explanatory and response). The form of the scatterplot is linear or curvilinear. Take note that the scatterplot follows the trend of the model you are attempting to use. Identify outliers and discuss whether they may be overly influential outliers. In the case of overly influential outlier, you may need to remove these points and re-examine your model. 1. Introduction: You are to introduce your topic with research information including: a. A title slide with your project title, class, semester, year and instructor. b. A slide stating the variables you are analyzing. c. Provide a scatterplot of your data (without any regression curves drawn on the graphs) d. What models you will be using to model your data. e. Include the website from which your data was collected. 2. Linear a. b. c. Regression Analysis: Find the linear model of the curve that models your data set. Create a scatterplot, with the linear regression line. Describe the association, if any. Create a residual plot of your data about the regression line and describe it. What is the slope of the prediction equation? Interpret this slope in the context of the data including units. d. What is the y-intercept of the prediction equation? Interpret this y-intercept in the context of the data including units. e. What is the correlation coefficient and what does this tell us? f. What is the coefficient of determination, r2? (Do not interpret meaning here.) g. What is the standard error of regression, Se? (Do not interpret meaning here.) h. Does there appear to be any influential outliers? If there are, identify them in ordered pair format and decide if you should remove from the data set. 3. Non-linear Analysis: Now find the quadratic model of the curve that models your data set. a. Create a scatterplot, with the regression curve. b. Create a residual plot of your data about the regression curve and describe it. c. What is the coefficient of determination, r2? (Do not interpret meaning here.) d. What is the standard error of regression, Se? (Do not interpret meaning here.) 4. Overall Analysis: Provide a table or chart that compares the residual plots, r2, and Se of both models (use the table below). When comparing your residual plots, you will need to incorporate a slide with both of your labeled residual plots to provide a visual for the comparison. Use your table of these criteria to determine which of your models you think would be the best to use and why. Include the following in your presentation. Then decide which of the two (if any) is the better model for your data set. Model Residual Plot se r2 No pattern or pattern? If there is a pattern, describe the shape. Linear Quadratic 5. Based on your best fit model only, interpret both the r2 and Se in the context of your data. 6. Conclusion: Make an appropriate conclusion. Is your best fit model useful to make predictions within the scope of the data given the values of r 2 and se ? Can you conclude that there is a correlation between your two quantitative variables? What statistical evidence do you have to support your conclusion? 7. Presentation: You will also be graded on your presentation as well as your content. Your eye contact, enthusiasm, and overall presentation will be factored into your grade. Each person in the group should be present and participate in the presentation for credit. You will lose points if you are a disrespectful listener as well. If you are not listening intently for others’ presentations, you will lose points. 8. Make sure you turn in your self-grade report which is 25% of your grade. It should be a private evaluation of yourself and your group members. Fold the paper in half when you turn it in. If you are not present for the presentation, your grade is a zero. Save your data on excel and clean up. Remember not to use symbols such as commas or $. Statcrunch: 1. To obtain the scatterplot without regression line/curve: Graph-scatterplot 2. Linear model: Stat-regression-simple linear For the residual plot Stat-regression-simple linear-scroll down to graphs and choose ‘residual index plot’ 3. Quadratic model: Stat-regression-polynomial (same instructions for residual plot)


