AU9
advertisement

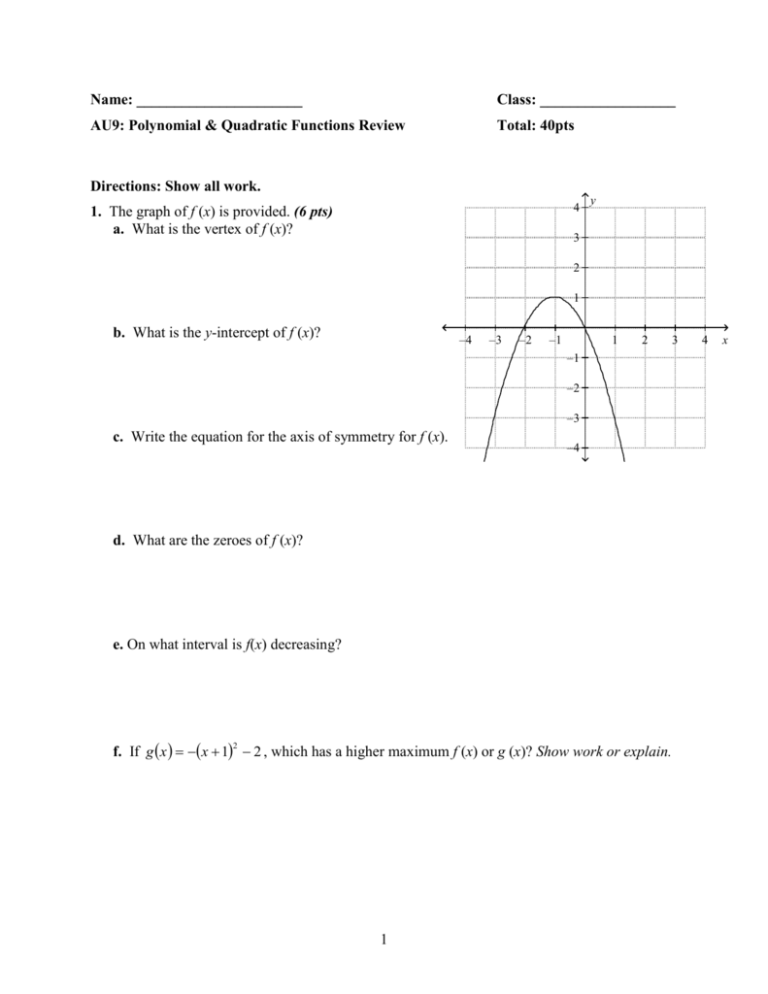
Name: ______________________ Class: __________________ AU9: Polynomial & Quadratic Functions Review Total: 40pts Directions: Show all work. 4 1. The graph of f (x) is provided. (6 pts) a. What is the vertex of f (x)? y 3 2 1 b. What is the y-intercept of f (x)? –4 –3 –2 –1 1 2 –1 –2 –3 c. Write the equation for the axis of symmetry for f (x). –4 d. What are the zeroes of f (x)? e. On what interval is f(x) decreasing? f. If g x x 1 2 , which has a higher maximum f (x) or g (x)? Show work or explain. 2 1 3 4 x y x 2 2x 2. Solve the following system algebraically: y x 4 (4 pts) 3. Let f x x 2 3 . for any real number x. (6 pts) Describe how the graph of each function below is a transformation of the graph f x x 2 3 : hx f x 2 ix 3 f x g x f x 3 2 4. Answer the following questions using the function f x x 3 6 x 2 5x . (6 pts) Identify the zeroes of the function algebraically. Use the graphing calculator to approximate the relative maximum and minimum, to the nearest tenth. Make a sketch that includes the key features listed above. y x 3 5. A ball is thrown into the air with an upward velocity of 30 ft/s. Its height h in feet after t seconds is given by the function: h 16t 2 30t 6 . a. Sketch the function on the graph below: b. What does the constant in the function refer to in context of the situation? c. In how many seconds does the ball reach its maximum height? Round to the nearest hundredth. d. What is the ball’s maximum height? Round to the nearest hundredth. e. How long is the ball in the air? Round to the nearest hundredth. 4 (4 pts) 6. On the set of axes below, solve the following system of equations graphically for all values of x and y. (4 pts) y x 2 6x 1 y 2x 6 y x 5 7. Analyze these data sets, recognizing the unique pattern and key feature(s) for each relationship. Use your findings to fill in the missing data. Match the table to the correct function from the list on the right. Describe the key feature(s) that helped you choose the function. Equations: f x 6 x h x 3 x 2 18 2 g x 4 x 6 Table A: __________________ Key Feature(s): Table B: __________________ Key Feature(s): 6 (4 pts) 8. A swim team member performs a dive from a 14-foot-high springboard. Their height was measured over the course of time by an observer and the results are as follows: (6 pts) Time (seconds) Height (feet) 0.0 14 0.1 17 0.2 22 0.3 23 0.4 21.9 0.5 19 0.6 15 What type of function is the best fit for this data? Explain how you know. Write an appropriate regression equation with the coefficients and constant rounded to the nearest hundredth. Based on your function, after 8 of a second, will the diver be in the water? Justify your answer. 10 7


