11 Solubility Lab Analysis
advertisement

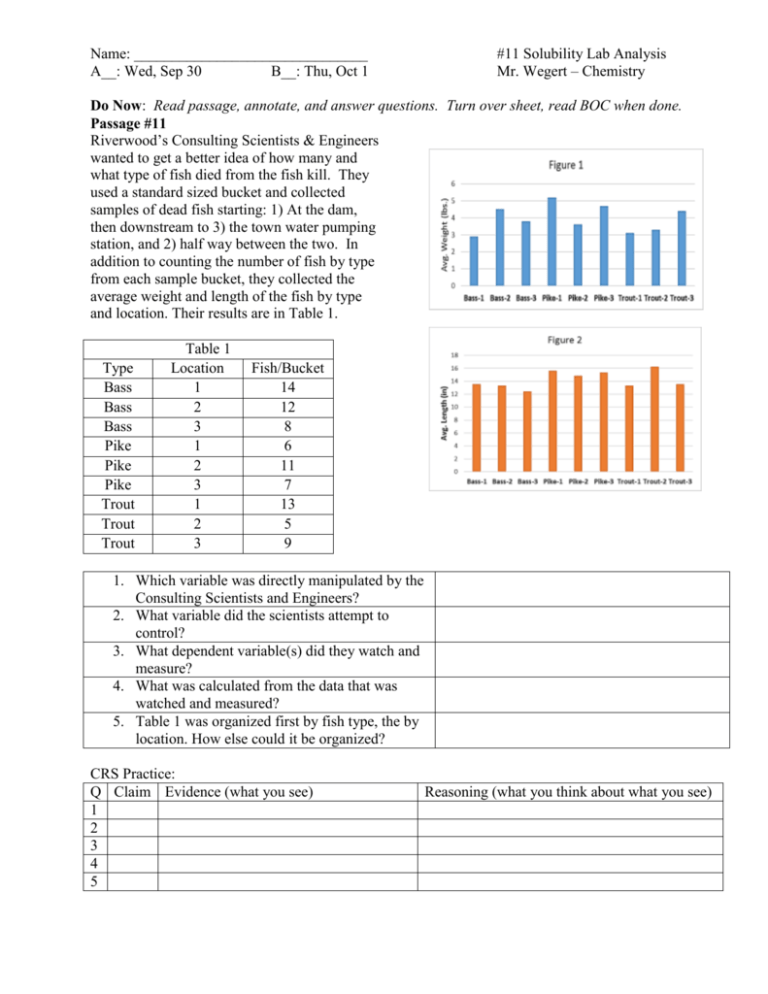
Name: _______________________________ A__: Wed, Sep 30 B__: Thu, Oct 1 #11 Solubility Lab Analysis Mr. Wegert – Chemistry Do Now: Read passage, annotate, and answer questions. Turn over sheet, read BOC when done. Passage #11 Riverwood’s Consulting Scientists & Engineers wanted to get a better idea of how many and what type of fish died from the fish kill. They used a standard sized bucket and collected samples of dead fish starting: 1) At the dam, then downstream to 3) the town water pumping station, and 2) half way between the two. In addition to counting the number of fish by type from each sample bucket, they collected the average weight and length of the fish by type and location. Their results are in Table 1. Type Bass Bass Bass Pike Pike Pike Trout Trout Trout Table 1 Location 1 2 3 1 2 3 1 2 3 Fish/Bucket 14 12 8 6 11 7 13 5 9 1. Which variable was directly manipulated by the Consulting Scientists and Engineers? 2. What variable did the scientists attempt to control? 3. What dependent variable(s) did they watch and measure? 4. What was calculated from the data that was watched and measured? 5. Table 1 was organized first by fish type, the by location. How else could it be organized? CRS Practice: Q Claim Evidence (what you see) 1 2 3 4 5 Reasoning (what you think about what you see) Lab Results Analysis: At 70 oC, what was the solubility from your class results? _____ cm. What was expected? _____ cm. Why might they be different? _____________________________________________________ Group Work (refer to the passage) Homework: Read page 61 and review 1.39 in textbook Homework (write in agenda): Complete table above Worksheet turn-in: #8___ #9___ #10___ #11___ Total ____/40 pts # 11 Solubility Lab Analysis ____/10 pts


