revised supplement data_10102013
advertisement

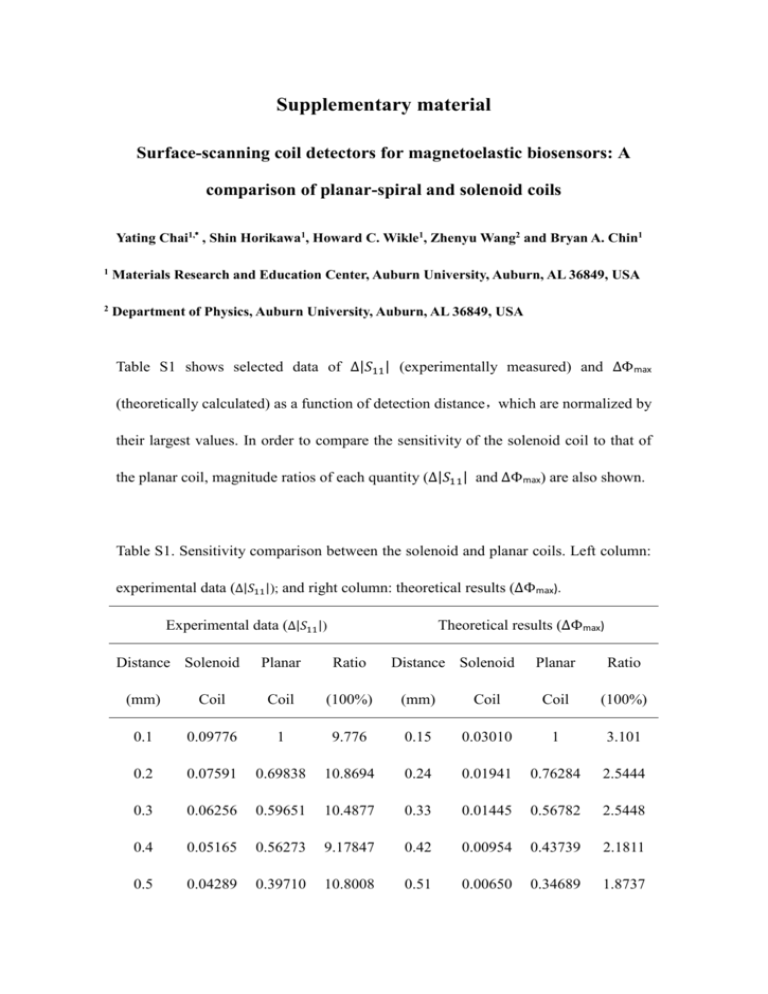
Supplementary material Surface-scanning coil detectors for magnetoelastic biosensors: A comparison of planar-spiral and solenoid coils Yating Chai1,* , Shin Horikawa1, Howard C. Wikle1, Zhenyu Wang2 and Bryan A. Chin1 1 Materials Research and Education Center, Auburn University, Auburn, AL 36849, USA 2 Department of Physics, Auburn University, Auburn, AL 36849, USA Table S1 shows selected data of Δ|𝑆11 | (experimentally measured) and ΔΦmax (theoretically calculated) as a function of detection distance,which are normalized by their largest values. In order to compare the sensitivity of the solenoid coil to that of the planar coil, magnitude ratios of each quantity (Δ|𝑆11 | and ΔΦmax) are also shown. Table S1. Sensitivity comparison between the solenoid and planar coils. Left column: experimental data (Δ|𝑆11 |); and right column: theoretical results (ΔΦmax). Experimental data (Δ|𝑆11 |) Distance Solenoid Theoretical results (ΔΦmax) Planar Ratio Distance Solenoid Planar Ratio (mm) Coil Coil (100%) (mm) Coil Coil (100%) 0.1 0.09776 1 9.776 0.15 0.03010 1 3.101 0.2 0.07591 0.69838 10.8694 0.24 0.01941 0.76284 2.5444 0.3 0.06256 0.59651 10.4877 0.33 0.01445 0.56782 2.5448 0.4 0.05165 0.56273 9.17847 0.42 0.00954 0.43739 2.1811 0.5 0.04289 0.39710 10.8008 0.51 0.00650 0.34689 1.8737 0.6 0.03511 0.29967 11.7162 0.60 0.00454 0.28117 1.6147 0.7 0.02018 0.20833 9.68655 0.69 0.00362 0.23165 1.5627 0.8 0.01330 0.15816 8.40921 0.78 0.00261 0.19323 1.3507 0.9 0.01190 0.12020 9.90017 0.87 0.00192 0.16273 1.1799 1.0 0.00949 0.08830 10.7475 0.96 0.00143 0.13811 1.0354 Table S1 shows that both Δ|𝑆11 | and ΔΦmax decrease as detection distance increases. In addition, the planar coil was found to detect much larger signal amplitude. However, comparing with the Δ|𝑆11 | signal, the ratio of ΔΦmax is much smaller. Furthermore, the ratio of Δ|𝑆11 | signal maintains at a certain range (8.4% to 11.7%), while the ratio of ΔΦmax decreases exponentially (shown in Fig. S1). Hence, the relationship between S11 signal and magnetic flux change needs to be discussed. FIG.S1. The ratio of the theoretical results as a function of detection distance. The magnetic flux change from sensor’s vibration is mutually coupled with the coil detector and causes a change in the impedance of the measurement circuit. This impedance change was determined using a network analyzer configured to measure the input reflection coefficient (S11 parameter). Fig. S2 depicts an equivalent circuit of a network analyzer, an electromagnetic coil, and the ME sensor.1 In loop I, V and Zs respectively denote the network analyzer’s source signal and impedance. Loop II comprises the electromagnetic coil. This coil is inductively coupled with the ME sensor, shown in loop III. To simplify the analysis, the motional, core, and leakage impedances of the ME sensor are lumped together in the form of a series RLC circuit.1-3 If Zi is the impedance of loop i. Hence, 𝑍II = 𝑍𝑅2 + 𝑍𝐿2 + 𝑍𝐶2 = 𝑅2 + 1 1 𝑗𝜔𝐿2 + 𝑗𝜔𝐶 and 𝑍III = 𝑍𝑅3 + 𝑍𝐿3 + 𝑍𝐶3 = 𝑅3 + 𝑗𝜔𝐿3 + 𝑗𝜔𝐶 , where j is the unit 2 3 imaginary number, and ω is the angular frequency. FIG.S2. Equivalent electric circuit for an ME sensor inductively coupled with an electromagnetic coil. Neglecting the ME resonator and the mutual inductance, the load impedance of only the coil is given by: 𝑍𝑎𝑏 0 = 𝑍𝐶 2 (𝑍𝑅 2 + 𝑍𝐿 2 ) 𝑍II (S1) When the ME sensor is in the vicinity of the coil detector and coupled magnetically with the coil, the load impedance becomes: 𝑍𝑎𝑏 𝑍𝐶 2 [(𝑍𝑅 2 + 𝑍𝐿 2 )𝑍III + 𝜔2 𝑀2 ] = 𝑍II 𝑍III + 𝜔 2 𝑀2 (S2) It is obvious that if the mutual inductance M = 0, Eq. S2 simplifies to Eq. S1. The impedance difference, due to the presence of the ME sensor, is: ∆𝑍𝑎𝑏 = 𝑍𝑎𝑏 − 𝑍𝑎𝑏 0 𝜔2 𝑀2 𝑍𝐶22 = 𝑍II (𝑍II 𝑍III + 𝜔 2 𝑀2 ) (S3) In addition, the equation for the relationship between the load impedance, Zab, and S11 signal is as follows: 𝑆11 = 𝑍𝑎𝑏 − 𝑍𝑠 𝑍𝑎𝑏 + 𝑍𝑠 (S4) Equation S3 shows the load impedance difference increases with increasing mutual inductance as a result of the vibration of the ME sensor. Since the test signal mainly depends on the load impedance difference, increasing the mutual inductance is a key to improving signal amplitude. In this way, the signal of Δ|𝑆11 | mainly depends the magnetic flux change, but they are not linearly correlated. Therefore, the experimentally measured signal amplitude, Δ|S11 | , and theoretically calculated magnetic flux change, ΔΦ, cannot be directly compared by normalization. References: 1. Y. Chai, H.C. Wikle, Z. Wang, S. Horikawa, S. Best, Z. Cheng, D.F. Dyer and B.A. Chin, J. Appl. Phys., 114, 104504 (2013). 2. S. Horikawa, D. Bedi, S. Li, W. Shen, S. Huang, I. Chen, Y. Chai, M.L. Auad, M.J. Bozack, J.M. Barbaree, V.A. Petrenko, and B.A. Chin, Biosensors and Bioelecronics. 26, 2361 (2011). 3. V.A. Petrenko and I.B. Sorokulova, J. Microbiological Methods 58, 147 (2004).


