Sequencing of the TSC1 and TSC2 genomic loci
advertisement
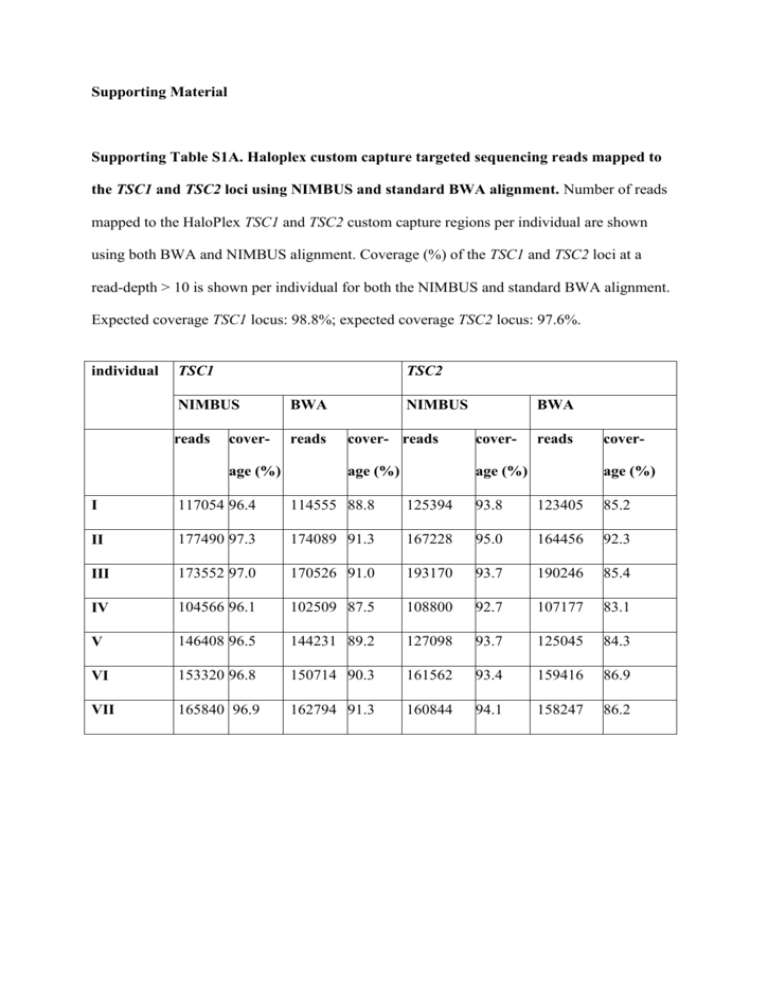
Supporting Material Supporting Table S1A. Haloplex custom capture targeted sequencing reads mapped to the TSC1 and TSC2 loci using NIMBUS and standard BWA alignment. Number of reads mapped to the HaloPlex TSC1 and TSC2 custom capture regions per individual are shown using both BWA and NIMBUS alignment. Coverage (%) of the TSC1 and TSC2 loci at a read-depth > 10 is shown per individual for both the NIMBUS and standard BWA alignment. Expected coverage TSC1 locus: 98.8%; expected coverage TSC2 locus: 97.6%. individual TSC1 TSC2 NIMBUS BWA reads reads coverage (%) NIMBUS BWA cover- reads cover- age (%) age (%) reads coverage (%) I 117054 96.4 114555 88.8 125394 93.8 123405 85.2 II 177490 97.3 174089 91.3 167228 95.0 164456 92.3 III 173552 97.0 170526 91.0 193170 93.7 190246 85.4 IV 104566 96.1 102509 87.5 108800 92.7 107177 83.1 V 146408 96.5 144231 89.2 127098 93.7 125045 84.3 VI 153320 96.8 150714 90.3 161562 93.4 159416 86.9 VII 165840 96.9 162794 91.3 160844 94.1 158247 86.2 Supporting Table S2: Overview of Haloplex targeted genomic sequencing of the TSC1 and TSC2 loci. The number of heterozygote (het) SNPs and InDels per individual are indicated. Possible mosaic changes are indicated in brackets. Cases where an individual was homozygote for the minor allele (hom), and variants detected previously by Sanger sequencing are also shown . “New” variants are those that have not been described previously. 1. screening predominantly with DGGE/SSCP; 2. screening predominantly with Sanger sequencing; 3. Southern blotting; 4. FISH. In all cases MLPA and Q-PCR were performed. S2A: TSC1 locus individual SNP het. InDel hom. het. hom. GoNL "new" "new" previously SNP SNP InDel identified het. het. het. I 2 25 2 0 0 4 0 0 1, 3, 4 II 69 13 5 0 2 2 (1) 1 (1) 31 III 58 9 2 0 0 0 0 11, 3, 4 IV 74 10 7 0 1 0 0 21 V 1 25 2 0 0 1 1 02 VI 0 25 1 1 0 1 0 02 VII 32 3 2 0 1 0 0 02 S2B: TSC2 locus individual SNP het. indel hom. het. hom. GoNL "new" "new" previously SNP SNP indel identified het. het. het. I 2 8 0 0 0 4 (1) 1 (1) 01, 3, 4 II 11 0 3 0 0 0 1 01 III 9 1 0 0 2 1 (1) 0 01, 3, 4 IV 22 19 3 1 0 1 0 21 V 12 0 3 0 0 0 0 12 VI 34 0 2 0 0 1 0 102 VII 40 (4) 1 5 0 0 4 0 82 Supporting Table S3. Peak ratios Sanger sequencing Individual variant mean peak ratio (mutant/wild-type) forward fold reverse fold change sequence change sequence with respect reaction with reaction to index respect to index III TSC2 0.057 1 0.177 1 0.004 0.07 0.094 0.53 0.005 0.09 0.073 0.41 0.059 1 0.205 1 0.085 1.44 0.071 0.35 0.027 0.46 0.056 0.27 c.3099C>G (p.Y1033*) mother of TSC2 individual III c.3099C>G (p.Y1033*) father of TSC2 individual III c.3099C>G (p.Y1033*) VI TSC2 c.2838122G>A mother of TSC2 c.2838- individual VI 122G>A father of TSC2 c.2838- individual VI 122G>A
