Graph Interpretation Notes
UNIT 1 Lesson 1: Graphs of Piecewise Linear Functions
Vocabulary:
The graph of a ________________ function makes a straight line.
A _________________ has parts or pieces of several functions.
Define Linear Piecewise Function .
Examples of Linear Piecewise Functions:
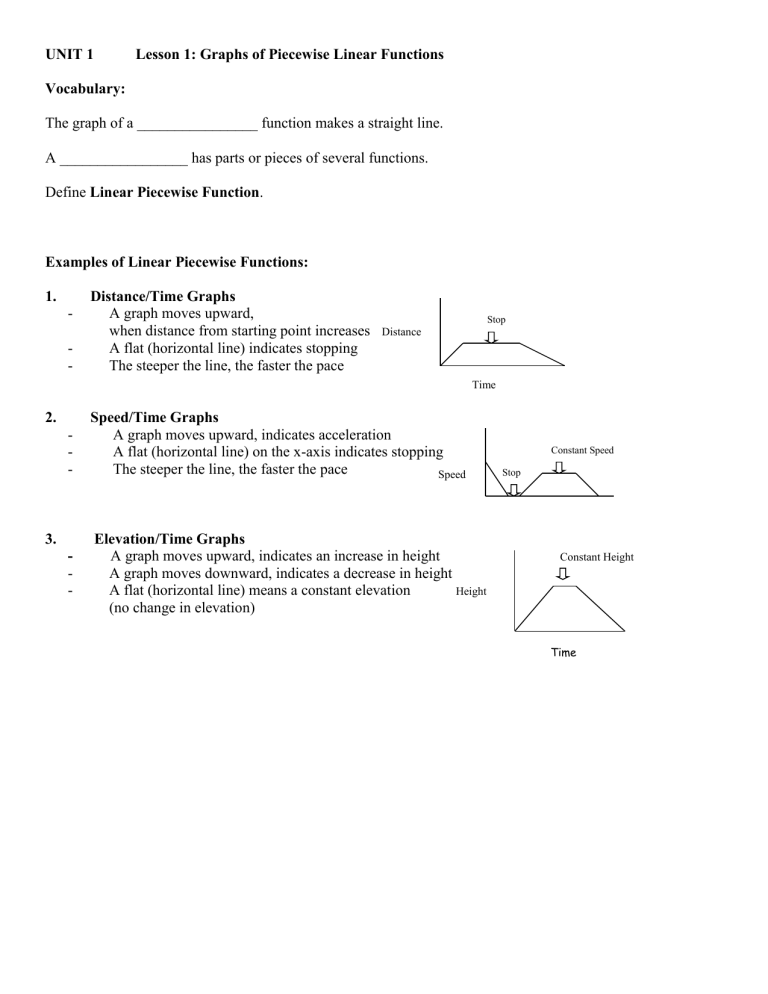
1. Distance/Time Graphs
- A graph moves upward,
when distance from starting point increases
A flat (horizontal line) indicates stopping
The steeper the line, the faster the pace
2.
Distance
Speed/Time Graphs
A graph moves upward, indicates acceleration
A flat (horizontal line) on the x-axis indicates stopping
The steeper the line, the faster the pace
Speed
Stop
Time
Stop
3. Elevation/Time Graphs
- A graph moves upward, indicates an increase in height
- A graph moves downward, indicates a decrease in height
- A flat (horizontal line) means a constant elevation
Height
(no change in elevation)
Constant Speed
Constant Height
Time
Practice
1. Here is an elevation-versus-time graph of a person’s motion. Can we describe what the person might have been doing?
2. The graph above is a piecewise function. Describe in your own word why this graph would be called “piecewise”.
3. Make up an elevation-versus-time graphing story for the following graph:
The graph shows the relationship between time and total distance traveled by a teacher riding a bus.
4. What does the flat part of the graph represent?
Distance
5. The first section of the graph is steeper than the last section.
Was the bus traveling faster in the first part of the trip or the last?
The graph shows the speed a student traveled on the way to school.
6. What do the flat parts of the graph represent?
Speed
7. Circle the sections of the graph that show speed decreasing.
The graph shows the relationship between time and speed for an airplane.
8. circle the sections of the graph that show the speed increasing.
9. box the sections of the graph that shows the plane not moving.
Speed
10. cloud the sections of the graph that shows the plane moving at a constant speed.
Bus Ride
Time
Trip to School
Time
Airplane Speed
Time
HOMEWORK:
Draw your own graph for this graphing story. Use straight line segments in your graph to model the elevation of the man over different time intervals. Label your -axis and -axis appropriately and give a title for your graph.
A man climbing down a ladder that is feet high. At time seconds, his shoes are at feet above the floor, and at time seconds, his shoes are at feet. From time seconds to the second mark, he drinks some water on the step feet off the ground. Afterward drinking the water, he takes seconds to descend to the ground and then he walks into the kitchen.
In your graph, what does a horizontal line segment represent in the graphing story?
Suppose the ladder is descending into the basement of the apartment. The top of the ladder is at ground level
( feet) and the base at the ladder is feet below ground level. How would your graph change in observing the man following the same motion descending the ladder?
Over which interval does he descend faster?
