Double Pendulum Chaos: Numerical Analysis & Lyapunov Exponents
advertisement
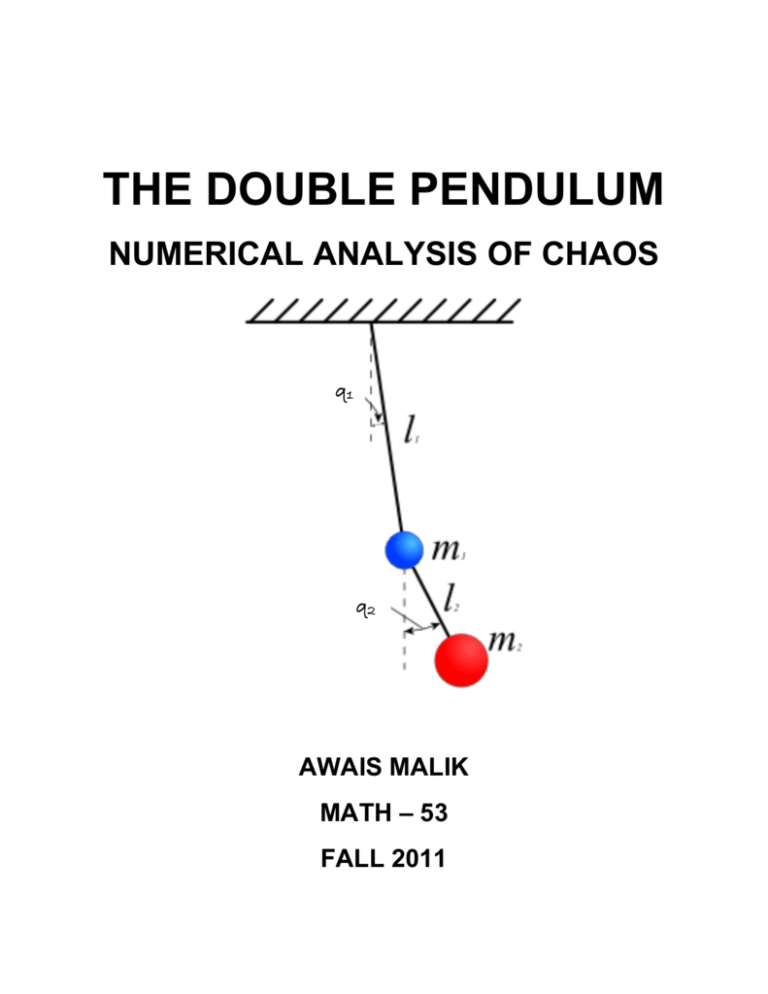
THE DOUBLE PENDULUM NUMERICAL ANALYSIS OF CHAOS q1 q2 AWAIS MALIK MATH – 53 FALL 2011 INTRODUCTION: The planar double pendulum serves as a paradigm for chaotic dynamics in classical mechanics. The character of its motion changes dramatically as the energy is increased from zero to infinity. At low energies, the system represents a typical case of coupled harmonic oscillators, and therefore, can be treated as an integrable system. At very high energies, the system is again integrable because the total angular momentum is a second conserved quantity besides energy. At intermediate energies, however, it exhibits more or less chaotic features. In this region of intermediate energies, we can observe a transition to global chaos via the decay of a last surviving Kolmogorov-Arnold-Moser (KAM) torus. (Ohlhoff and Richter, 2000) This paper shows my attempts to numerically analyze the double pendulum system to show the passing of the system from an integrable one to a chaotic one as energy increases to intermediate values. All numerical analysis was done using MATLAB, specifically ode45, to solve the system of 4 first-order Hamilton’s Equations of Motion. I also attempted to calculate the derivatives for the Jacobian matrix using Wolfram Alpha. I constructed Poincare sections by keeping track of when the angle of deviation (q2) of the second mass, m2, becomes 0◦. We can then plot any two of the remaining three variables. I chose to plot the momentum (p 1) of the first mass, m1, versus angle of deviation (q1) of the first mass, m1. Finally, I calculated Lyapunov exponents using a very crude method. I found the slope of ln|p2(a)–p2(b)| vs. time plot where initial values of p2(a) and p2(b) vary by 10-8. I tried finding the 4x4 Jacobian matrix in order to use the more accurate method highlighted in the script file “lyapflow.m,” but as shown later, the derivatives became too long and too complicated to be used in MATAB, and for complete analysis to be done in time. DERIVATION OF HAMILTON’S EQUATIONS OF MOTION: Consider a double bob pendulum with masses m1 and m2 and attached by rigid, massless wires of lengths l1 and l2. Also, let the angles the wires make with the vertical be denoted as q1 and q2. Finally, let the acceleration due to gravity be g. The positions of the bobs are given by the following equations: 𝑥1 = 𝑙1 sin(𝑞1 ) ; 𝑦1 = −𝑙1 cos(𝑞1 ) 𝑥2 = 𝑙1 sin(𝑞1 ) + 𝑙2 sin(𝑞2 ) ; 𝑦2 = −𝑙1 cos(𝑞1 ) − 𝑙2 cos(𝑞2 ) The potential energy (V) of the system is then given by: V = 𝑚1 𝑔𝑦1 + 𝑚2 𝑔𝑦2 = −(𝑚1 + 𝑚2 )𝑔𝑙1 cos(𝑞1 ) − 𝑚2 𝑔𝑙2 cos(𝑞2 ) The kinetic energy (K) is given by: 𝐾= 1 1 1 1 𝑚1 𝑣1 2 + 𝑚2 𝑣2 2 = 𝑚1 𝑙1 2 𝑞1̇ 2 + 𝑚2 [𝑙1 2 𝑞1̇ 2 + 𝑙2 2 𝑞2̇ 2 + 2𝑙1 𝑙2 𝑞1̇ 𝑞2̇ cos(𝑞1 − 𝑞2 )] 2 2 2 2 The Lagrangian (L) is then: L≡𝑇−𝑉 = 1 1 (𝑚1 + 𝑚2 )𝑙1 2 𝑞1̇ 2 + 𝑚2 𝑙2 2 𝑞2̇ 2 + 𝑚2 𝑙1 𝑙2 𝑞1̇ 𝑞2̇ cos(𝑞1 − 𝑞2 ) 2 2 + (𝑚1 + 𝑚2 )𝑔𝑙1 cos(𝑞1 ) + 𝑚2 𝑔𝑙2 cos(𝑞2 ) Now we can compute the generalized momenta, 𝑝𝑖 𝑝𝑞1 = = 𝜕𝐿 𝜕𝑞𝑖̇ 𝜕𝐿 = (𝑚1 + 𝑚2 )𝑙1 2 𝑞1̇ + 𝑚2 𝑙1 𝑙2 𝑞2̇ cos(𝑞1 − 𝑞2 ) 𝜕𝑞1̇ 𝑝𝑞2 = 𝜕𝐿 = 𝑚2 𝑙2 2 𝑞2̇ 2 + 𝑚2 𝑙1 𝑙2 𝑞1̇ cos(𝑞1 − 𝑞2 ) 𝜕𝑞2̇ The Hamiltonian (H) is then given by: 𝐻 = 𝑞𝑖̇ 𝑝𝑖 − 𝐿 = 1 2 1 (𝑚1 + 𝑚2 )𝑙1 2 𝑞1̇ 2 + 𝑚2 𝑙2 𝑞2̇ 2 + 𝑚2 𝑙1 𝑙2 𝑞1̇ 𝑞2̇ cos(𝑞1 − 𝑞2 ) − 2 (𝑚1 + 𝑚2 )𝑔𝑙1 cos(𝑞1 ) − 𝑚2 𝑔𝑙2 cos(𝑞2 ) Solving the generalized momenta equations for q1 and q2 and plugging back into the Hamiltonian equation: 𝐻= 𝑚2 𝑙2 2 𝑝𝑞1 2 + (𝑚1 + 𝑚2 )𝑙1 2 𝑝𝑞2 2 − 2𝑚2 𝑙1 𝑙2 𝑝𝑞1 𝑝𝑞2 cos(𝑞1 − 𝑞2 ) 2𝑙1 2 𝑙2 2 𝑚2 [𝑚1 + sin2 (𝑞1 − 𝑞2 ) 𝑚2 ] − (𝑚1 + 𝑚2 )𝑔𝑙1 cos(𝑞1 ) − 𝑚2 𝑔𝑙2 cos(𝑞2 ) This leads to the Hamilton’s Equations of Motion: 𝑙2 𝑝𝑞1 − 𝑙1 𝑝𝑞2 cos(𝑞1 − 𝑞2 ) 𝜕𝐻 = 2 𝜕𝑝𝑞1 𝑙 1 𝑙2 (𝑚1 + 𝑚2 𝑠𝑖𝑛2 (𝑞1 − 𝑞2 )) 𝑞1̇ = 𝑞2̇ = 𝑙1 (𝑚1 + 𝑚2 )𝑝𝑞2 − 𝑙2 𝑚2 𝑝𝑞2 cos(𝑞1 − 𝑞2 ) 𝜕𝐻 = 𝜕𝑝𝑞2 𝑙 2 2 𝑙1 (𝑚1 + 𝑚2 𝑠𝑖𝑛2 (𝑞1 − 𝑞2 )) 𝑝𝑞̇ 1 = − 𝜕𝐻 = −(𝑚1 + 𝑚2 )𝑔𝑙1 sin(𝑞1 ) − 𝐶1 + 𝐶2 𝜕𝑞1 𝑝𝑞̇ 2 = − 𝜕𝐻 = −𝑚2 𝑔𝑙2 sin(𝑞2 ) + 𝐶1 − 𝐶2 𝜕𝑞2 𝐶1 = 𝐶2 = 𝑝𝑞1 𝑝𝑞2 𝑚2 𝑠𝑖𝑛(𝑞1 − 𝑞2 ) 𝑙1 𝑙2 (𝑚1 + 𝑚2 𝑠𝑖𝑛2 (𝑞1 − 𝑞2 ) [(𝑙 21 𝑝2 𝑞 (𝑚1 + 𝑚2 ) + (𝑙 2 2 𝑝2 𝑞 𝑚2 ) − (𝑙1 𝑙2 𝑚2 𝑝𝑞1 𝑝𝑞2 cos(𝑞1 − 𝑞2 ))] sin(2(𝑞1 − 𝑞2 )) 2 1 2𝑙 21 𝑙 2 2 (𝑚1 + 𝑚2 𝑠𝑖𝑛2 (𝑞1 − 𝑞2 ))2 NUMERICAL EXPERIMENTS: System Parameters: For simplicity, I decided to use unit lengths and unit masses, i.e. m1 = m2 = l1 = l2 = 1. The acceleration due to gravity, g = 9.81 m/s2. Initial Conditions: Case 1: I only changed the momentum (p2) of the second mass, m2, while keeping all other initial conditions constant at zero. Thus, q1i = q2i = p1i = 0. I used p2 values of 1, 5, 6 and 10. When p2 = 6, the Poincare Section is particularly intriguing. Case 2: I changed both momenta (p1 and p2) but kept them equal to each other, while keeping both initial angles of deviations constant at zero. So, q1 = q2 = 0. I used p1 = p2 = 1, 5, 10. Case 3: Finally, I decided to test the accuracy of this system model by starting the system at an unstable equilibrium point. Here, q1 = q2 = 𝜋, and p1 = p2 = 0. Mathematically, the pendulum should stay inverted, but as Demo1.m shows, it falls down and starts oscillating. Key Plots: The MATLAB file FinalProject.m plots all the key figures required to understand the change in one variable with respect to another or with respect to time. The following example highlights the behavior of q1 vs time, dq1/dt vs q1 and q2 vs q1 respectively (I.C: p2=1, q1=q2=p1 = 0): 0.3 0.2 Velocity dq1/dt 0.1 0 -0.1 -0.2 -0.3 -0.4 -1.5 -1 -0.5 0 0.5 Angle of Deviation q1 1 1.5 0.3 0.2 Angle of Deviation q1 0.1 0 -0.1 -0.2 -0.3 -0.4 0 10 20 30 40 50 time 60 70 80 90 100 0.5 0.4 Angle of Deviation q2 0.3 0.2 0.1 0 -0.1 -0.2 -0.3 -0.4 -0.5 -0.4 -0.3 -0.2 -0.1 0 Angle of Deviation q1 0.1 0.2 0.3 Lyapunov Exponents: I calculated Lyapunov exponents using a very crude method. I found the slope of ln|p2(a)–p2(b)| vs. time plot where initial values of p2(a) and p2(b) vary by 10-8. The main problem is that the slope is not constant, and I had to constantly change my time values to calculate the Lyapunov exponent from the slope before the values reached the O(1). My code for calculating the Lyapunov exponent can be found in ‘FinalProject.m’ and I have also attached the files ‘doublePendulum_time1map.m’ and ‘lyapflow.m’ I tried finding the 4x4 Jacobian matrix in order to use the more accurate method highlighted in the script file “lyapflow.m,” but as shown in the following links to Wolfram Alpha, the derivatives became too long and too complicated to be used in MATAB, and for complete analysis to be done in time. If I had more time, I would’ve tried to figure out how to make the built-in Jacobian calculating function in MATLAB work properly. Here are links to some of the obnoxiously large partial derivatives (of C2 only!): http://www.wolframalpha.com/input/?i=derivative+of+%28sin%282*%28q1q2%29%29*%28l2^2*m2*p1^2%2bl1^2*%28m1%2bm2%29*p2^2l1*l2*m2*p1*p2*cos%28q1-q2%29%29%2f%282*l1^2*l2^2*%28m1%2bm2*%28sin%28q1q2%29%29^2%29^2%29%29+wrt+q1&incParTime=true http://www.wolframalpha.com/input/?i=derivative+of+%28sin%282*%28q1q2%29%29*%28l2^2*m2*p1^2%2bl1^2*%28m1%2bm2%29*p2^2l1*l2*m2*p1*p2*cos%28q1-q2%29%29%2f%282*l1^2*l2^2*%28m1%2bm2*%28sin%28q1q2%29%29^2%29^2%29%29+wrt+q2&incParTime=true http://www.wolframalpha.com/input/?i=derivative+of+%28sin%282*%28q1q2%29%29*%28l2^2*m2*p1^2%2bl1^2*%28m1%2bm2%29*p2^2l1*l2*m2*p1*p2*cos%28q1-q2%29%29%2f%282*l1^2*l2^2*%28m1%2bm2*%28sin%28q1q2%29%29^2%29^2%29%29+wrt+p1&incParTime=true I hope three examples suffice. I did manage to complete the first two rows of the Jacobian in the script file ‘doublePendulum_time1map.m’ but the next two were ridiculously huge! Case 1: P2 values Lyapunov Exponent, h Chaos? 1 0.0492 (Negligibly +ve) No (Consider slope equal to 0) 5 0.7884 (+ve) Yes (Chaos also seen in Demo1.m) 6 0.7435 (+ve) 10 1.756 (+ve) Yes (but system gradually settles into a quasi-periodic orbit) Yes (Also seen in Demo1.m) Case 2: p1 = p2 values Lyapunov Exponent, h Chaos? 1 0.0346 (Negligibly +ve) No (Consider slope equal to 0) 5 0.2448 (+ve) 10 0556 (+ve) Yes (but system gradually settles into a quasi-periodic orbit) Yes (Also seen in Demo1.m) Case 3: In this case, my crude method fails to give a finite value of the Lyapunov Exponent. My program suggests that h = infinity. Poincare Sections: I constructed Poincare sections by keeping track of when the angle of deviation (q2) of the second mass, m2, becomes 0◦. We can then plot any two of the remaining three variables. I chose to plot the momentum (p1) of the first mass, m1, versus angle of deviation (q1) of the first mass, m1. The system is chaotic if it the Poincare maps fills (or appears to fill if iterated long enough) the entire 2D space. I used the script files ‘test_poincare.m’ and ‘zerocross.m’. I present here two examples using the initial conditions: q1 = q2 = p1 = 0, p2 = 5 and 6 respectively. When p2 = 6, we see a remarkable and somewhat inexplicable occurrence. Instead of trying to fill the entire 2D space, the points begin to concentrate themselves over what seems to be an attracting fixed point (possibly two when zoomed in into the attracting section). One reason for this seemingly bizarre occurrence would be the existence of an integrable island surrounded by chaos. This theory would be backed by our Demo for this set of initial conditions, which also describes the pendulum as “ gradually settling into a quasi-periodic orbit.” This result would also be consistent with the KAM theory which states that the motion remains perpetually quasi-periodic for a large set of initial conditions. However, previous research into the double pendulum negates this theory for this system, for Ohlhoff and Richter believe that a transition into global chaos eventually occurs after the last KAM torus has decayed. This decay appears to have happened when p2 was 5. Then why has the integrable island reappeared at p2 = 6? One step forward in this investigation would be to change the initial conditions but keeping the total energy, H, constant, and observing the behavior of the Poincare section when p2 = 6. Double Pendulum, Poincare section (q2=0, increasing) 7 6 4 3 1 p (Momentum) 5 2 1 0 0 1 2 3 4 q1 (Angle theta1) 5 6 7 Double Pendulum, Poincare section (q2=0, increasing) 7 6 4 3 1 p (Momentum) 5 2 1 0 0 1 2 3 4 q1 (Angle theta1) 5 6 7 CONCLUSIONS: Therefore, the double pendulum presents a wide variety of periodic, quasi-periodic and chaotic behavior. While my research tackled only the most basic cases, it presents an opportunity for future researchers (including myself) to delve deeper, and hopefully find more satisfying answers regarding exactly when does the transition to global chaos occur, for a certain set of initial conditions. The fact that an integrable island suddenly presented itself after global chaos had apparently occurred presents a fascinating mystery that I personally cannot wait to tackle further. SOURCES: 1. D. Sado and K. Gajos, Notes on Chaos in Three Degree of Freedom Dynamical System with Double Pendulum, Mechannica. 2. Tomasz Stachowiak and Toshio Okada, A numerical analysis of the chaos in the double pendulum, Chaos, Solitons and Fractals, 29, (2006), 417-422. 3. Troy Shinbrot, Celso Grebogi, Jack Wisdom, James A. Yorke, Chaos in a double pendulum, American Journal of Physics. 60 (6), June 1992, 491-499. 4. A. Ohlhoff, P. H. Richter, Forces in the Double Pendulum, ZAMM. Z. Angew. Math. Mech. 5. Ziliang Zhou and Chad Whiteman, Motions of a Double Pendulum, Nonlinear Analysis, Theory, Methods and Applications. Vol. 26. No. 7, 1177-1191 (1996). 6. R. B. Levien and S. M. Tan, Double pendulum: An experiment in chaos, American Journal of Physics, Vol 61, No. 11, (November 1993), 1038-1044. 7. http://scienceworld.wolfram.com/physics/DoublePendulum.html 8. http://myphysicslab.com/dbl_pendulum.html 9. http://www.maths.tcd.ie/~plynch/SwingingSpring/doublependulum.html 10. http://brain.cc.kogakuin.ac.jp/~kanamaru/Chaos/e/DP/ 11. http://online.redwoods.cc.ca.us/instruct/darnold/deproj/sp02/herman/win.pdf
